Back in the UK which means I have lots of spare time on the weekends. So I wanted to share some general market thoughts while I had been away.
Volume Study
I keep on hearing everywhere that volume is disappearing and this market is about to fall over as a result on top of the bearish divergences. Anyone who is following me on disqus may have read some of my comments in regards to those topics.
Let me start with volume first. First of all volume is an indication of shares traded and NOT actual value. A stock trading at $20 will trade more shares for the same dollar amount then if that same stock were at $50. So looking at SPY the disappearing volume can be very deceiving as we had a huge move in terms of price. Generally a market or equity does not move 60+% in such a short time frame so you have to be very careful when applying volume studies in your trading.
So in order to show this graphically I have taken the daily price and volume levels for spy since Feb 2009 towards December 2009 and calculated the actual dollar value moved and then averaged out on a daily basis and taken against a base unit for comparison purposes so you can show volume and adjusted dollar value side by side. As I had mentioned the results may surprise many and actually shows that for the past 6 months we actually had volume that can sustain this rally. Yes of course one can take this further and apply the loss in value for the dollar which will be another exercise – but ultimately it matters what dollar is doing on the US markets while the global comparison to dollar may be another interesting aspect.

I wanted to wait till January is over to show the jan data but based on the current numbers, it should exceed the last 6 months in terms of dollar value moved while volume may be lower. That is quite substantial. Also when looking at December one can see while volume appears very low we actually had quite a lot of dollar value moved even with the holidays.
MACD
You all know that MACD is my favorite indicator and I have been playing around with it quite a lot on various time frames and wanted to show you some other interesting studies.
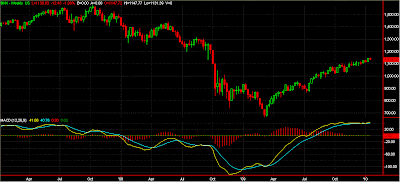
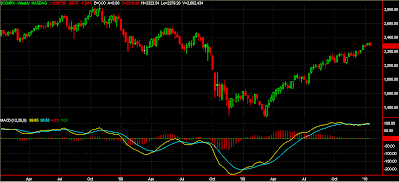
Now this is a beauty at first – it looks ready to fall over but you have to be very careful. It is very rare for the MACD divergence to stay so close to zero for such a long time frame on any scale. Considering this is a weekly chart this is substantial and can setup for a strong move into negative divergence. But take a look at what our buddy Nasdaq did instead.
As you can see it went into slight negatives making me believe it will turn just to reverse back above into what appears to be building more positive divergence. As you can see we moved another 10% higher after it went negative. So the same could happen with SPX as its playing catch up with nasdaq.
Now lets have another close look at MACD on the daily over a much longer time frame. We want to play close attention this time to the daily divergence. So what we are looking for is …. “The montly range of the daily macd divergence” – sounds a bit confusing but take a look at the chart.
You can see a narrow monthly range in our bullish cycle before the recession started (blue box), right after you saw the range expanding as we entered the first leg of the recession (yellow), then of course the crash with a very wide range (red box). As we moved on from the crash we continued trading in wide monthly ranges similar to before the crash (yellow) but as you can see we are now entering a phase of smaller monthly daily ranges.
Before I finish on the MACD I have one last treat to share. It appears many indicators are showing bearish divergences on the daily. This has always been something that I used quite heavily in the past but one has to differentiate between short term bearish divergences and long term bearish divergences. If a divergence appears on a chart it will generally resolve to the bearish side within a specific time frame – if that does not occur it is not a reliable bearish divergence anymore. When looking at daily MACD the break point is generally 3 months (you can look at many charts and see that after 3 months this becomes unreliable). So what does that mean? Are our divergences bearish? Yes in a way but since reliability declines the longer they exist we have to be a bit more on our toes and combine other indicators. So lets do an MACD study but also include RSI.

I maximized the MACD and the RSI here for better visibility. Also I changed the RSI indicator to level at 50. Why? On the daily an RSI over 50 is bullish while an RSI below 50 is bearish. As as you can see while the MACD continued giving us bearish divergences the RSI conflicted with that message and showed that while we have a bearish divergence there – we have a bullish signal on RSI. So its important to make sure that you do not just rely on one single indicator.
So what does all this mean? (yeah lol)
Of course I am trying to prepare the data and charts to come up with a conclusion and as you may have expected – it can rain or it can stay dry.
It almost appears that we have received our last signals that would confirm a longer term bullish cycle to follow. Looking at the decent numbers for adjusted dollar to volume that support a bull market as well as the macd monthly daily ranges, it almost appears that we are moving forward in a bull. At the same time we still have other charts such as the weekly that support a bearish case.
Generally I try to give you my opinion and how it will affect my trading but at this point all I wanted to do was share my findings and analysis. You all know I am a bearish trader from a longer term perspective but one cannot ignore the facts that money is put to work in the market and that bearish patterns have not played out. We continued breaching one resistance level at a time and my theory of overhead supply to bring down the market seems to be dead.
Now what does that mean for 2010? To be honest it’s very possible that 2010 is going to be a snooze fest, at least the next 6 months and that we may move +- 10%. On the other hand we have moved up so strong in terms of price – nothing like ever seen before. Can we rally another 10%? Sure, but what about another 20 or maybe even 30 or 40? I say “no way jose!!”. I will continue to look for signs of a break down ready to pile in on the short side. I do not believe the “recession is over in 18 month” story – not this time. But why would it be different? I hate hearing that statement because you can also say “this is a never before seen event” – both can be right. Our recession is over and we will slowly re-attempt higher prices, or this recession is much more severe then anyone could imagine (yeap I am a believer of the second).
So if indeed we are moving in a bullish longer term cycle ones trade style has to change as it will be more difficult to play purely SPX. As a result I will be focusing a lot more on FX and trading specific stocks. I will also be a lot more active during OPEX with short term trades - in the past I have always avoided OPEX and tried to minimize my positions during that week.
I will try to post more in the next few months as I have more free time on the weekends. This was just some build up thoughts in my head that I wanted to share with all of you.
EDIT: for anyone thinking that I am turning bullish and giving up my view of SPX 480. I am still a strong believer in this. While you might ridicule me for such a statement this is still a strong possibility and I will continue being cautious whether I am short or long. However, I am not going to sit around waiting for it to happen. The other thing one has to consider is that the past 9 months is not the norm of what happens in markets - yet many consider what has happened since the march lows as the new mean. Maybe I am falling for this as well but the point is that I am looking to make money on the markets. In 2008 my primary focus was SPX and I did well, in 2009 of course it did not turn out as good but we are here to make money - whether its trading SPX or trading equities - money can be made with proper analysis.


