The market really knows how to get us frustrated beyond any acceptable levels. I hold told myself to hold on before shorting as we have a short holiday week. Holiday weeks almost NEVER have a sell off or trend reversal to the downside - quite the opposite, reversal to the upside or bullish trend is very likely. Can this time be different?
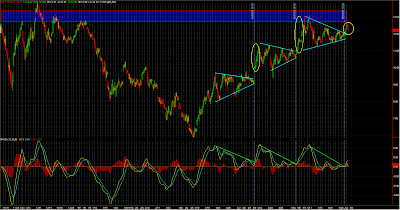
I am not sure, looking at the chart here (still the same trendlines) we hit the perfect targets - exact W2 retracement I was looking for - textbook EW and a break of the previous W4 high. XLF and IYR erasing most of yesterdays gains and SPX working hard to do the same.
Chart wise - yes this is what we were expecting - holiday time wise its not. Yet again did the buss leave without me and the market did not give me a chance to get the position I wanted. Last week when we were trading at 880 I told myself that if we are to reach 92X again and possibly 930 I would load up on shorts very large - here we are in this range and I looked for an excuse not to enter when the charts were screaming - short.
Quite a difficult position I find myself in now - we do not chase, so what to do here? Wait for a retracement that may never come? Scale into short now just to be trapped for more upside for the remainder of the week? Sit out and let this go all the way to 900 and below and miss a great position again? - as you can see - we are in quite a predicament here - and I am unsure of how to proceed. Will give it some more time and then figure out what to do. We are still within acceptable levels and a decent risk margin of 12 points (as I am writting this the market keeps on dropping so our risk margin keeps on increasing).
Tuesday, June 30, 2009
Monday, June 29, 2009
In Short Target Zone
ok sorry for all the posts with little content. At this point we are hitting our target zone and should have a high probability for a test at the 930 range.
I will re-add shorts with 40% exposure and will enter my first short via futures here as well.
Will post updates as I take positions but wanted to make everyone aware to look for updates soon. I have 2 time targets 11:45-11:50AM or 1:25-1:35PM.
I will re-add shorts with 40% exposure and will enter my first short via futures here as well.
Will post updates as I take positions but wanted to make everyone aware to look for updates soon. I have 2 time targets 11:45-11:50AM or 1:25-1:35PM.
Count Update
Position Update
Will be looking to close out all shorts here in the morning as mentioned last week as I am expecting more upside.
Friday, June 26, 2009
Added Shorts
SKF @ 41.98
SRS @ 19.97
SWG SL @ 1.28
SWG TL @ 2.77
30% exposure
EDIT: position prices - was too focused on entries
SRS @ 19.97
SWG SL @ 1.28
SWG TL @ 2.77
30% exposure
EDIT: position prices - was too focused on entries
Another Miss
Missed my long play today by one point. Looking at this range and the previous days I would expect 2 scenarios.
1) close right around 927 with a rally starting at 3:05
2) stay within the daily range and get a close around 922 with a last 10 minute rally of a few points
Do not expect any more downside for the day today.
If scenario one plays out I will start to get back into my shorts here right at the close.
SRS, SKF, SPY puts and my first future IT short position.
Missed UNG
Just an update on UNG. I had been trying the long play here a few times over the past 2 weeks. My final target was 13.85. Unfortunately the market will not make it easy for any of us. Low on wednesday was 13.95.
I may give this one a try again next week as its a bit too late to join the game here. Anyone still holding UNG (Ryan I hope so). Good job =)
The one I keep on trying on
Take a look at DTG. This is one that will be ripe for the picking once the markets make a move. I have been trying to short this one for the past 3 weeks without much luck. Lucky for me the stops were easy to be managed so losses were minimal.
Once the time comes, this one will be going south FAST. I am still amazed it made it this far here.
Thursday, June 25, 2009
Double Pin
Yesterday 900, today 920. Incredible - I mean everyone already knows they are doing it - so they may as well make it as obvious as they can. Of course that could all just be a coincidence - just like last nights stop clean up (yeah I got hit too)
Let me ask you guys a very basic question - and I want an honest answer. Why are we trading this? I am seriously considering staying out a bit more. I keep on telling myself that just to come back the next day for more - but this chop is getting very frustrating.
Ok new game plan
Today definitely did not play as anticipated. I had entered quite a few shorts yesterday before the announcement with the anticipation of getting a move higher yesterday. While we are getting a move higher today I was very concerned due to the sell off action yesterday and this mad rally here on little news. Additionally the crazy overnight action had me pondering what they are trying to do here.
So looking at it from a bearish EW perspective this is playing out as a wave 2 with a typical 61.80% retracement that plays right into our resistance zone. Additionally a close for the month above 920 (4 more days) would also play into the bearish case from a monthly perspective.
So now its just wait and see what the market does. I had opened quite a few more short positions earlier today but with tight stops - at this point I still have a bit of short exposure but waiting to add the big chunk soon.
The blue triangle represents my risk zone here all the way to 937 levels. This range should hold the market off - however, this is a new range that I did not have considered previously as my upper ranges were bound by 924. As a result I have to rethink position sizing a bit more due to risk management. Will figure out what exactly I will be doing once I place my trades.
Will also update on twitter.
Good luck.
Quick update
The recession is over. Just got the memo. Thx =)
A bit crazy to say the least. I am getting the higher prices I was looking for. Yesterday I would have been very happy to see higher prices, however, after the FED meeting and no strong news anywhere seeing a rally such as this - not feeling good being a bear now. Will wait this one out before committing any more money. I was long pre-market off the low but had closed out at the morning peak. Now not quite sure what to make of this.
Short Update
What a close - pinned right at 900 to make sure we get a close in key bull range. My plan at the moment is still to reload shorts this week - I started with small positions yesterday morning with the anticipation of adding more today. In a way I was hoping for higher prices to be able to get a short with less risk but it seems the market will not allow anyone to get the entry they are looking for - bulls or bears alike.
Sam, I know many are going back and forth with EW's here - many different counts all with different scenarios. As you may remember I have my reservations with EW - I like using them for confirmations BUT there is always a count for something, bull or bear - so treat any counts with care here. Range bound markets like to screw up counts and give you the "ability" to create counts for either side.
At this point caution is still needed. I am quite "frustrated" with the dollar here - keeps on back and forth without any more and pressured by 2 trend lines. Which one will win? No idea quite yet.
I am really liking what the monthly chart is setting up for - the upside is pinned at 924 SPX and the close at 900 leads me to believe that we will try to continue in a narrow range here until the end of the month with a close anywhere from 900-924. If we can manage to stay above 900 here for the month it would be a perfect setup for 2 strong monthly down bars. As a result I am going to continue to use the next few days to build up my IT shorts. This time without closing them after 30 points (heh). I am still not quite ready on the futures side and continue to use futures to scalp and swing trade to offset any pain I have to endure if we go higher.
For the bulls - we need to try to stay above the 895 SPX cash levels, a break below 900 off the open will require a reversal within 2 hours with a low of 895. A breach of this level will trigger selling and bulls may give up the fight to become dip buyers at the 875 levels.
For the bears - easiest position to be in at the moment. Any rally above 900 is a great place to enter shorts with a 24 point risk exposure. Great play would be - buy SPY/SSO at a break of 900 (stop 895) and continue adding shorts as it rallies. If you get 920 prices close out the hedge and add the last chunk to your shorts.
Wednesday, June 24, 2009
Surprise Surprise !!!
Ok I had closed out all my shorts since Monday with the last batch closed out yesterday. My initial plan was to try to get back into my shorts here shortly with some new additions and slight changes after having had a great run.
However, while going through my watch lists yesterday I have to admit I was quite surprised. Looking for short setups I saw the majority of them in a bullish pattern with strong support just on their door step. While calculating proper stops for each position I realized that risk/reward ratios are not very favorable at the moment as I had to assume too much upside risk with many being close to support. Of course breaking said support will bring a nice wide range of gains but I could not get myself to find entries that are favorable.
As a result, out of the 50+ positions I was closely watching I only found a handful that showed signs of weakness with a high probability move lower. Due to the current conditions I am going to keep my short exposure very limited until we can see a clear break towards a move lower. I am not afraid to miss the boat here and the market is at an important juncture in terms of 200dma and 50dma.
It is very interesting that we have had 2 days now around the 890 range here and have not seen volatility step in in terms of moves to the downside. MANY bears have had a great run and want to protect profits - me included.
Special Note
I have been slacking quite a bit the past 2 weeks to provide proper guidance as I had done in the past. Between many work related items and personal issues I have not had the time to properly outline market direction via the blog. I tried my best to give important turning points in short notes or via comments but did not find the time to properly describe confirmations and anticipated moves for bulls and bears alike. I should be back in normal mode in a week or so when non-market related items in my life have slowed down a bit more. Sorry, everyone =)
Tuesday, June 23, 2009
Dollar ....
You keep on hearing me talk about the dollar as a strong basis for my positions. We have to really look at this carefully whether you are long or short as it will drive pricing.
I had just talked about the dollar range this morning in terms of coiling and consolidating - this looks like a strong move up here.
Positioning for the next move
Well the bears definitely had their day yesterday. While I had some great profits I had closed out some of my shorts a bit too early in the fear of a mid day reversal. As a result I tried quite a few long attempts yesterday anticipating a move that never came. Considering the GAP down, and the breath we had yesterday I am really not sure why I kept on trying to get in on the long side when the signs for further downside were clear.
Either way, made good profits and closed out many positions. Overall I expect a bit further downside but not by much. You keep on hearing me talk about buffer zones, in this case the 900 range and I am always looking for a minimum of 10 points below a specific support zone for a clear break. This did not occur so from here on out we have to approach the market with caution. My primary focus is closing out short positions today to take profits and let the market show me direction.
I had entered some new bullish positions late last night to help offset shorts in case we get some strength here on the upside. One of the key drivers for me has been the dollar that I use as a strong base for position management. It has done well for me in the energy sector and commodities, however, those have had a strong run towards the downside erasing a large chunks of the gains that were made over the past 3 months. I have to admit, I was not as committed to this down move in terms of capital and leverage as I would have liked to, however, I am glad I approached this here with caution.
So for now I will remain rather flat going forward until the first week of July. I had mentioned in the past that time wise I was looking for the first week of June or first week of July for a top or an end for this rally. We are right in the middle and I will not yet commit myself fully on the short side. I do expect us to see the 900 range again in the short term, the question still remains whether or not we will setup for a test and possibly break of the 880. Something that should take quite a bit of work here.
Ryan, in regards to gold, I see the dollar pressure as quite a negative for upside on anything gold related. I would expect some rebound but overall I would not expect many gains to be had in this area. Commodities and Energy are quite difficult to trade at the moment (bullish or bearish) as we have had quite a down move already. One thing to keep in mind, energy and commodities have been leading indicators in the past to give us a clue of where we will head. Dollar is showing quite a bit of weakness today again and we have to be quite careful here on direction. The same way the market has been coiling in a narrow range the past month we are seeing similar signs in the dollar - so watch this very carefully for an indication of direction.
I really like the setup UNG is giving us, an easy mid term trade to take as we have some clear signs of where the bottom is, with great upside potential. My targets for UNG at this point are focused on the risk of the downside which is very limited in terms of trading - upside should be great once we see a confirmation of a move. Great risk/reward ratio. My position is very small in this area and I am playing Oil and Nat Gas on both sides - short and long until we have a direction.
Monday, June 22, 2009
More Covering
Closed more then half of shorts here. Will be looking for another push down tomorrow morning or during overnight action. But expecting a reversal most likely in the first hour of trading tomorrow or pre-market.
Remaining Short Positions
POT
RIMM
NTG
IFN
ASH
CME
OI
CTV
MCRS
DIOD
DTG
IBM
MSFT
New Long Today
UNG
Remaining Short Positions
POT
RIMM
NTG
IFN
ASH
CME
OI
CTV
MCRS
DIOD
DTG
IBM
MSFT
New Long Today
UNG
Closed some positions
Closed all of SRS and SKF. While we can expect more downside we are too close to important support of XLF and IYR. Will re-add on pullbacks if we cannot make a move here to the upside.
ES limit order long @ 895.50 with stop @ 893 (day trade), expecting 10 points out of this move towards 1:30PM EST.
Took partial profits
Took around 15% profits here off short positions and added a small long hedge via futures. Not expecting it to rally much before before hitting 893-895.
Sunday, June 21, 2009
USD signs
Just a quick update here. EURUSD just broke an important trend line here on the 60 min chart. This is the sign I was looking for and as a result I remain short without any hedges for this overnight action here.
Seeing this nice drop here right off the open indicates further weakness and should give us continuation into the first few days this week. I am not quite ready to go in heavy via futures and will continue to short term/day trade with my futures account until the trend becomes clear again.
As mentioned last week, we do not yet know the direction, while we had many signs of June 11th begin a top, I remain very cautious until we have traded outside of this 2 month range here. I still see a possibility for further highs here towards the first week of July with a 1014 target (a target I have referred to many times). However, its not a target I am currently trading against as I am quite short via equities and ETFs.
Have a good night and talk to you all tomorrow.
Friday, June 19, 2009
Afterhour Trades:
- Closed SDS and moved into SKF (SKF my largest position at the moment)
- * shorted JPM
- * shorted GOOG
- Exited UNG at a small loss
* pinned to price, should reverse and has an extremely narrow stop loss. Big risk/reward ratio so its super easy to take this. Now that I am writing it, considering putting some more into it.
Thats it. Going for some drinks now =)
Have a good weekend all.
Going into weekend
Staying as is.
- Closed out futures (after seeing that drop after hours would have liked to have kept position but taking profits after a break of 920 SPX was a good move)
- keeping all positions (all bearish)
- no hedge
That rally there at the end really was quite a curve ball - but what else can you expect here. To be quite honest, no idea where we going to head for Monday/Tuesday. We are nicely bound by 930 and all my shorts will still be profitable at that level (barely). So I am glad to be on the outside of the range there.
Otherwise, of course looking for the 894-895 level first. Once we get there, we will have to see, if we manage to stay above 900 until Wednesday I see more upside first and possibly a new high. We will have to see.
Have a good weekend everyone. Relax and get rest for another crazy week.
Odd SPY ES divergence
As mentioned I had changed my stops yesterday slightly above the high of the day. Stops were hit but one thing I noticed is a very strong divergence between ES and spy this morning. I had seen small divergences before but we are talking about almost 4 points here.
Not quite sure what to make of this. As a result I had re-shorted my original position close to the morning high at ES and re-added my other limit orders.
Today is option expiration so it should be fairly range bound. I will hold on to all shorts today even if we make a move towards the 928-930 range on SPX. While we should expect a spinner I am looking for a below 920 close on SPX. Any close above and I have to figure out what to do with my shorts into the weekend.
Thursday, June 18, 2009
Targets Today
Looking for S&P to test the 924 range and potentially overshoot by 2-3 points. Will be adding shorts at this level again and enter new positions.
Current Position summary:
- Short Oil (DTO, DUG)
- Short Technology (AAPL, RIMM, IBM, MSFT)
- Short Commodities (POT)
- Short some emerging market funds
- Short Financials and Real Estate (via SKF, SRS)
No futures position yet. At the moment 40% committed on capital.
At the moment I can sustain a run towards 937 before having to worry about closing out or hedging. Those are long term positions and will only be closed with 2 closes above 924 level.
I may hold off on futures until we see the 890-892 levels for a reversal to back test the upper ranges. Will hedge long at that point for a swing trade but keep all core positions listed above.
Wednesday, June 17, 2009
Quick Short Target Update
Just a quick update. Looking for SPY to hit around 92.37 to possibly scale into more shorts.
Tuesday, June 16, 2009
What was that?
No short covering, no dip buying, we actually had a sell off into the close with a new low. What is that I smell? I am getting a little excited here that we may have a new trend in the making. We shall see. For now lets do some review and figure out what comes next.
Still undecided
Just a short note. We have many signs of a bearish case falling into place:
- IYR breakout of the channel
- XLF at the edge of breakout
- Dollar having formed a nice head/shoulder after having found strong support as we expected
- oil topping at $73
- Noob index selling off (AAPL)
- coiling/spinning tops resolved to downside yesterday
While all of this looks very bearish - I have no idea where we will head. My first assumption was a run towards the 928-937 range today that would stall. I had placed limit short orders yesterday around those key ranges but removed them just before heading to bed last night.
I honestly do not know where the market will turn. Yesterday could have been a nice fake out as we had very low volume and closed (barely) in the bullish channel/formation.
If we are to see ourselves in a widening pattern here (the coiling from last week) we have more upside to hit the 964 I had mentioned so many times. What really bugs me is that the top from last week does not make sense - it really does not. There is only very weak support for last week being the top and it would really surprise me if this rally goes out with such disappointment. We have not seen crazed short covering, crazed last minute buying or any signs that normally manifest during tops. Additionally there is no time cycle to support this case, nor is there a strong topping pattern. While the spinning tops normally indicate a completion of a trend it should not exceed 2-3 days max and should have been much further away in terms of price from our one month consolidation zone.
Has this market finally played the trick of tricks on me? Making me believe we will go higher so I am stuck waiting for it to go higher to enter my shorts and play the bounce scenarios? I do not know. All I know is that I have no strong beliefs for either direction. Its kind of ironic that I have been so strong on the short side for this entire rally - and now here, when we have quite a few topping signs I shy away from this view.
Monday, June 15, 2009
Random thoughts ...
I am still here. Sorry for not having posted updates but been spending quite a bit of time away from the market.
Its ironic, I am still kicking myself a little from last week. Looking at AAPL and high of the index 4 days later is quite staggering if that does turn out to be the case.
At this point, we have broken an important trendline from last weeks spinning top madness. Whats even more surprising is the amount of people now turning bullish. xtrends remains bearish of course, slope is back on full bear mode. However many others are ignoring that we broke last weeks low and keep on going long. I did 3 long attempts myself this morning with a total of 1.5 point loss at this point.
I will post some charts tonight to see a breakdown of specific trendlines. Those could be interpreted as bearish signs but at the same time it could be setting up for a move higher. Do not think thats the case but I also do not think we will be giving up the 900 that easily.
880 is in the cards of course but I would not expect this to occur this week.
Currently we are in a really weird mid term phase. A high last week in the markets just does not make sense technically - in terms of price or in terms of time. At this point the time component is more important to me then price and a high last week does not work out in ANY of my time patterns or scenarios.
The only way the time component can work out if the first week of july represents a low to make a new high by August. Do not see how from a fundamental perspective we can make that happen.
There are too many scenarios for either side at the moment - none of them clear, none of them with confirmations. The only confirmation I can take at this point is a break from last weeks low, BUT holding 916 as important support.
Friday, June 12, 2009
WOW
Just been watching (small long this morning but thats it).
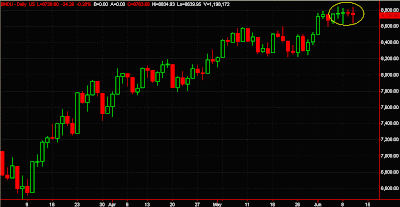
This market is incredible. NEVER ever seen this before. Take a look at the DOW daily. Incredible. Volume increasing and still the same range. This is going to be one amazing breakout whichever way it is.
As posted by zerohedge, the amount of margin in bullish funds is at extreme levels. What that means is that at the first sign of weakness the margin will be sold very quickly to avoid losses on capital. Of course this is all supporting my bearish stance but it should be very interesting.
Thursday, June 11, 2009
Short 50% via futures and SKF
Will add SRS on pull back. IYR has broken down too much already. XLF at key resistance while S&P made new high.
Up or down?
Yesterday
Another roller coaster of a day yesterday. Second attempt to GAP above 947 resistance level with a fast reversal that never looked back. Once the selling started it continued on its way all the way down to the bottom of the range. I had posted some charts yesterday with key sectors finding support at trendlines.
While I did take a trade on the long side yesterday I closed it out at my target of 937. I did say that I wanted to see a close above 937 for me to keep the position but it was a bit too close for comfort. We have had quite a heavy sell off in 2 of my key sectors (XLF, IYR), both of those sectors continue to be pressured greatly while S&P is going through a distribution in a very narrow range. As a result I took my small profits and ran for the hills. There are quite a few patterns in play at the moment not only on S&P but also other sectors. Some show potential resolution to the upside, some to the downside. Combine that with the 4 spinning tops on the DOW - its quite difficult to make a call here. "Normally" spinning tops at the end of a trend resolve into a reversal - will this occur here? To be quite honest I do not think so but I am not going to put my hand in the fire for such a call.
Looking at XLF and IYR I am having great concerns that the upside is extremely limited unless the bulls can step in today.
XLF has not been able to repeat the high it made previously and is forming a wedge. Of course wedges here during this rally have always resolved to the upside. Will this time be different? Do not think so but we have to keep this in mind.
IYR is showing great concerns as well. While we did make a marginal new high we broke the low of last week. We did manage to find support at the trendline but the rally was very contained.
I have told myself to stop sounding like a broken record but the rally in the afternoon was occuring on low volume. Compared to the sell off in the morning hours we did not come in with strength. This could have been a lot of short covering as traders are seeing the same pattners and also go with this assumption that there are no pull backs from this rally. If they are, its 30 points max, anything more then that and you are just lucky.
Today
I have to admit, I am not sure what will happen today. 4 spinning tops are a new one for me but they will lead to a strong move in terms of price over the next 4-5 days with a minimum of 40 points. All signs are showing that this move will potentially be to the upside - at the same time its a strong contradiction to my levels of 964 that are just around the corner.
As you know me I always make statements using "should", "could", "possibly". 964 is a VERY strong level for me and it WILL not break on the first attempt. Just as an FYI - whenever you make a strong statement like that you will make mistakes trading as this marries you to a specific view. So keep that in mind =). I guess I am trying to reemphasize how important this level is.
I will post some updates in comments today as the day unfolds for more direction.
Wednesday, June 10, 2009
A new one for me ...
Never ever seen anything like this. NEVER !!!! 4 spinning tops after a month of consolidation. Do not know what to make of something like this here. Whatever the next move is - it will be strong. And at this point we cannot say what direction. Using the wildly popular WAG indicator I would have to say the next 4 days should bring around 40-50 points worth of range.
Closed out
Yeap. Too scared to hold a long here. I know its quite silly to trade 4 points risk for 7 points gain but I rather walk away from this. I am much more comfortable holding a short at this point then a long - regardless of whatever trendlines are currently supporting the bulls.
Maybe I need to be sitting on the sidelines a bit longer =)
My First Dib Buy in a while
This is the sign everyone. I have done my first long purchase that was not a hedge or a 5-10 pt day trade. Entered long via SSO and some ES futures as well. 4 point stop on both of them.
XLF has found its trendline, S&P found its trendline (or close enough) and we are at 930 our previous distribution zone top.
Yes a bit speechless about this move as well here. Lets see how it plays out.
EDIT: Just some reason why I did this here.
XLF has found its trendline, S&P found its trendline (or close enough) and we are at 930 our previous distribution zone top.
Yes a bit speechless about this move as well here. Lets see how it plays out.
EDIT: Just some reason why I did this here.
Where to go from here?
Had quite a few personal issues to address the past few days. While I have been watching the markets I did not do much at all since last week Friday. The past 1.5 weeks have probably been my lightest days in terms of trading - and here we are having broken the 947 pre-market already.
It has been quite crazy. Dip buyers everywhere - yeah schismatic, it still works as unbelievable as it may seem =)
We have been consolidating around the 930 to 947 range and are poised for a breakout. The last time the market got a little ahead of itself we had sold off right away after we had hit 957 pre-market. This time around it may be a bit different. As mentioned in the past when we GAP over 1% in either direction there are 2 very high probability setups. The open +/- 2 points as the high/low of the day with continuation to close at the highs (potential stepping days) or a strong sell off after the open with a failed re-attempt at the high.
The other aspect I have mentioned many times is the buffer zone. Whenever a strong support/resistance point gets broken the market normally tries to put a large buffer onto that point within a short time frame to allow this range to be changed from support to resistance (or the other way around). We have had over one week now in a fairly narrow buffer zone of less then 20 points. We had one breach above this range that was reversed right away. At the same time we have managed to put in higher lows but kept the 947 area the same. Again another sign of this range being broken as the same resistance gets re-attempted with sell offs to various support ranges that will find its way back.
Now some other things to look for. 9 up days for apple in a row - last time that happened was our rally last year around the same time frame. AAPL ended up making another high around 2 weeks later followed by the 4 day bear market top. So what will it be this time? Top of this rally today or tomorrow or another 3 weeks. As per my long term outlook time wise we should have seen the top in the first week of June - I had mentioned we have a possible time overthrow of approximately 4 weeks which would put the top of this rally in the first week of July with a target of 1014 - I am not sure if this will occur and not saying thats how it will play out but I wanted to re-iterate what my past analysis has shown - again an analysis I did not profit from but we knew that already.
Now looking at the dollar, we have pinched the upper trendline early last week and have sold off from then. We managed to reverse the past 2 days however have not been able to retest the upper ranges - at the same time oil is making new highs - a strong divergence between those 2 components.
We are currently in divergence heaven here so the market needs to find its way back to a neutral zone. Regardless of those divergences from a pure charting perspective this is still tradable for some - I just decided to stay out until the market becomes a bit clearer even if that means having to wait before I can short again. Even a normal bull market would not have such strong disarray of indicators (for all the bulls out there heh).
So lets go back at the charts then.
I had removed my normal indicators and just focus on charts and volume. I have circled previous distribution zones that had always lead to a strong price move into the next range - this is not occuring here even though we are above the 200dma - instead we get indecision on every daily candle here with a narrow open close price on each of them. While the bulls have the upper hand it is only marginal.
If todays open can stick and be protected with higher prices and strong volume we may have seen a short/mid term decision for a new range. So watch today carefully.
Also take a look at cobras market review. He has some interesting information as always about topping zones and patterns he is using - especially the divergence from advancing issues and advancing volume is quite interesting.
I will be a bit more active again starting today so expect updates in the comments if I see something.
Key ranges again to look for today:
956-964 = I had mentioned that in the past, especially the 956 that we had tested last week pre-market. ANY break of 964 should be reversed within hours so watch out for this range here - only 10 points away at this point.
Monday, June 8, 2009
Some errands this morning
Will not have a chance to post updates till around 11:00AM. Will talk to you then.
On a side node ... look at the dollar (UUP), broke out, very strong volume the past week and most importantly on the 60min we have a strong bottoming sign on 6/2/2009 via MACD.
Either way - will be back later and sorry for no post this morning.
On a side node ... look at the dollar (UUP), broke out, very strong volume the past week and most importantly on the 60min we have a strong bottoming sign on 6/2/2009 via MACD.
Either way - will be back later and sorry for no post this morning.
Friday, June 5, 2009
My Desktop
Thursday, June 4, 2009
7 days in a row !!!
Yesterday
Another odd day to add to the list. I have to admit I was a bit surprised at the action after the open yesterday (excluding the close). We had a strong GAP down without any fill attempts. While we continued trading lower my key sectors Financials and real estate did not do anything. Both remained in a very narrow range most of the day. I did enter a small short off the open in both of those sectors but the hesitation throughout the day with the S&P500 divergence spooked me a bit. I had closed both of them out towards the afternoon at no gain/loss (covered fees and got some lunch money but thats it).
"If you do not understand it, get out and ask questions later". This was one of those for me yesterday. I expected a lot more action around key support ranges especially after the open but none occurred until the last hour.
Our daily volume continues to drop further and further. Considering we are moving at key ranges here we should be seeing new buyers step in. That is not the case and if you watch the 1-min bars carefully for many sectors we continue seeing quite a bit of selling pressures. The liquidity providers are doing a great job at hiding the real picture. This is not meant as a bearish support fact - just a mere observation I find interesting.
APPL - 7 days in a row. Thats a first for 2 years. There are only 2 other similar events with such a strong up move on the noob index as they were coupled with a distribution day in between.
8/14/2008 - 7 days + 1 down in between (bear market rally top at 8/18/2008)
5/6/2008 - 9 days + 1 down in between (bear market rally top at 5/19/2008 - apple did put in a higher high at 5/14/2008)
Both times APPL lead the bear market rally top by 4-5 days. So keep this in mind while we continue through our ranges here =)
Dollar Example
I am going to make a simple analogy so it makes a bit more sense.
My Cash: 1000 EURO (could be any other non USD based asset)
US Equity 1 share price: $100USD
Todays Exchange rate: 1 EURO = 1 USD
Today I could buy 10 shares of said company (10 shares @ $100USD = $1000 USD = 1000 Euro)
Tomorrows exchange rate: 1 EURO = 2 USD
Tomorrow I could buy 20 shares of said company (20 shares @ $100USD = $2000 USD = 1000 Euro)
So with the dollar decreasing in value US equities are cheaper. So lets look at the USD - Euro changes over the past 3 months. We went from 1.25 all the way to 1.42. Thats quite a big increase and another key driver why the markets have rallied so much. Thats what happens when you keep on printing money =)
So once the dollar finds support which it will very soon, the markets should make a turn as well. USD is a leading indicator meaning it takes a bit longer before the markets react. Thats why its important to watch this carefully so you can time the turns properly.
Today
I will post updates in comments. Not a lot of time this morning.
Wednesday, June 3, 2009
Distribution or weakness?
Yesterday
The morning started quite strong and had all indications for more ranges and volatility. However, after the first 30 minutes the day turned to a very slow grind to distribute.
"The only pull back we had seen yesterday was a test at the 937 range yesterday - this should hold as support if we continue a bit more on the upside."
We held important support at 938.46 and remained contained between the high and low of the day.
I was watching financials very carefully yesterday and further weakness was apparent with XLF closing in the reds and barely giving a test at the previous close. IYR showed similar signs of weakness.
However looking at the noob index AAPL we have up day number 6. Take a look at the daily on AAPL and look back at the last 6 months. What happened anytime this "index" has been up for more then 6 days? Can this be considered an indicator? You decide - from my perspective I have been using AAPL quite a bit as an indication for trend changes and tops.
Today
Yet again it is not an easy day to make a call today. While the market has built up a nice buffer off the 930 range we still have to worry about a retest of this range. I would have expected a run up into the 950 range first before retesting so we have to see and wait for the market to show is the direction here.
Bulls have a the upper hand here as we are still above the 200dma for 2 days in a row now. Based on distribution yesterday we can expect to remain above this range here but we need to show follow through to make this breakout stick. This includes bringing the lagging sectors above their current top ranges as well. Unless the bulls can make a stand here across other sectors we should see downside pressures arise soon.
For the bears it is a bit difficult. A few advantages exist especially in financials and sectors that caused this crisis not able to break above key resistance ranges. As we are increasing in price and distributing the crisis leaders (financials, real estate) are showing further weakness. This could setup for a nice reversal if other sectors fail to make new highs. At this point bears have to be patient and let this pattern come to a closure point before making any calls.
Special Note
I had mentioned the dollar over the past few days and we are seeing further weakness in this area. It seems we are not the only ones that have picked this one up so many are watching this closely. Be aware that a the dollar is currently trading at key ranges and should find support. For bulls this is a major concern at the moment while the bears are on the edge of getting a big advantage here if it does turn in their favor.
Support and Resistance
Just going to state numbers here as many are repeats. I am adding one new one on the upper ranges.
964
956
947
937
930
Tuesday, June 2, 2009
Time to fire up the grill for some beef?
Yesterday
I made quite a large post yesterday to do a more detailed review of what happened during the day. It was quite an important day with lots of information to absorb. Technology breaking out, energy breaking out yet my key drivers for market rallies are lagging - especially financials. Take a look at AAPL - what I consider the noob index - 5 up days in a row showing the race for not being left out of this rally. Additionally technology had another win yesterday thanks for CSCO being added to the DOW. On the energy side we have a weak dollar driving global commodity prices. We have a bit more to go on the dollar side I think but this move should be over soon. If the dollar does not turn here soon - and by soon I mean as early as this week potentially next we may have some more difficulties ahead - bear or bull.
"Ok we have quite a GAP to deal with here. Forget about my GAP trade lesson you can find on the right hand side. This GAP here will be very important and only gives 2 scenarios. Scenario one is the most likely with the Open price today being the low of the day (give or take 2-3 points) and a rally higher to close the day at 945 or the last resistance level of 956."
While we did not get to the 956 level, the most likly scenario played out perfectly with the exception of not closing at the highs.
Today
As we are currently navigating at the extreme end of the spectrum it is quite difficult to make a call here. 3 up days in a row, one of them with a break through major resistance. We had no significant pull back on S&P500 yesterday so I would expect some profits being taken today. On the other hand - as I had described on the 120min chart yesterday there is a very good potential that we continue rallying. Trying to catch a long at this point is impossible so even if you are a bull, long term or not, you will be looking at protecting yourself via short plays today.
The only pull back we had seen yesterday was a test at the 937 range yesterday - this should hold as support if we continue a bit more on the upside.
My best case scenario for today - that is for both bulls and bears is a break of 947 and a test at the 954-956. I will be going short at this level fairly heavy and will decide after the entry if this is going to be a short term or mid term play. The market will retest breakout ranges so its a low risk trade that will give me a chance to get out if I am wrong without much of a loss.
I will be posting updates via comments again today whenever I see important turning points.
Monday, June 1, 2009
Ok - too many charts ...
First, today was an important enough day to put in some overtime and review a bit more then usual. I will review my longer term targets by the end of this week.
VIX Daily
Lets start with the easy one first. As you can see VIX is breaking trendlines on both sides of the spectrum and is whipsawing violently back and forth here. Makes me feel good that I am not the only one that doesn't have a clue of where we going - everyone else running for protection and hedges on both sides.
SPY Daily
Just an updated chart here. I did not include the bollingers but you know how they look like with 2 breaches now on the upper band. You remember me saying that a bear market rally has ONE breach on the upper ranges - we now have had 2 breaches with a full month in between. Can this still be a bear market rally? Yes of course. Can this be the first leg of a bull cycle that will last a bit longer then 3 months? Yes of course. Ok then tell me what it is !!!! - not so fast here. We need to let the market show us what it will do. Take a look at the volume, for such an important move to see below average volume is not a strong sign. I will address some more concerns later but lets leave this chart as is.
SPY Daily - last 200dma breach
Here is a chart of pretty much today minus one year when we had the last breach on the 200dma. While this rally was a lot shorter you had similar whipsaw around the first top, some sell off and consolidation and then a new high. On the MACD there you have 3 moves - one long extended one, one shorter one, and one last very short one. Compare that to our current moves - while they are much more extended especially during the consolidation phase we are seeing similar behavior. I am not saying it was the same but take a look at the first above average volume bar you saw there. This is something any bull has to be watching very closely.
SPY 120 min
Lets have a look at another interesting perspective here on our major index. I had put up the 120min chart MACD and RSI level. We have seen 3 extremes during the past 6 months with MACD and RSI breaches above normal levels. On each of the extreme breaches the market continued at least one more day even after MACD started to turn lower. Lets see what happens this time around. This is not something I use for my trading but I found it rather interesting that even with such overbought conditions in the past we have managed to not reverse right away. As you can see each time we had seen continuation we had a VERY strong reversal bringing us back below the breakout range in terms of price. For us now that could mean a run towards 956 with a reversal back to 920.
Make your pick next ....
I have 3 core short positions that I trade in and out off. S&P500, Financials, Real Estate. So lets disect the later 2 in a bit more detail to make a call here.
IYR Daily
At first it almost looks like a perfect textbook breakout. Nice little channel it has been trading in with distribution after the first major resistance test. Both the lower channel and the descending channel put pressure on this index and it pooped out pretty much at the end of the pattern completion - it literally made a move on the last day here. The key on this breakout is the volume showing above average volume and a great move in terms of price. However, one thing of concern is the pull back with a close below key resistance - a textbook breakout would have a close above this key line. Additionally we have a 2 very strong resistance levels fairly close coming up as the next target so quite a bit of work here is needed to go higher. Now if you take a look at the 1 min charts for today - you can see the majority of the above intra-day average volume bars were all declining candles especially into the close - low volume run up on prices while the down bars had the big money behind them. End result is still an upday so price wins over volume.
XLF 120 Minutes
This one is quite interesting. Due to this one I went short today with my trigger happy fingers but forced myself to stop out (you know when you move your stop to a point knowing that it will get taken out - only reason you do that is because you know it was an impulse trade - ok enough of that did not loose money but did not make much either).
You can see 3 beautiful little triangles there. Each consolidation leads to a great 2 day jump higher without looking back and taking out the previous high with conviction ... wait, something wrong. What happened here on the last one? Ooops someone decided not to play nice here. XLF has taken out major resistances in the past with ease and now is showing signs of struggle for the first time. Why is that? Well maybe because all banks were able to go through their capital raises and there is no more need to push those bad boys up? =) ok I promised myself not to say manipulation - there are very valid reasons for this last 3rd failed attempt, considering that we have seen dilution of share holders and an important cluster of resistance levels - it was just fun to say it though to make me feel a little better (and yes saying the market is manipulated is just an excuse for having timed the short entries incorrectly - I get it).
Ok so lets take a look at XLF in a bit more detail.
XLF Daily
It seems XLF is coming to a complete stop soon here. Volume continues to decline and for the first time we have not been able to follow through with a new high after a period of consolidation. we have yet to see the 200dma and the 50dma will race closer as we continue here without making a new high. To make matters worse, when everyone was making new highs with wide ranges on the upside today XLF closed at 0%.
Just another chart
Not commenting on bearish/bullish here. Just giving another perspective.
- Bollingers now breached for the second time at 2.5 deviations (very bullish and sign for me that this is not a bear market rally).
- MACD at zero again after dropping below zero during consolidation (bullish)
- MACD failing to make new high (would be bearish under normal circumstances but bullish here due to 200dma break)
Excited to see what volume will be looking like at the end of the day. Either way. If this holds above 918 by Wednesday - I may be a buyer.
The day GM went bankrupt
Previous Trade Day
"Bulls have the upper hand yet again, while it seems this changes on a daily basis further continuation today is likely with a break above 920. Bears should not be reattempting the sell side here and more bulls should be coming in with buying interest to take the market higher.
If the bears can manage to turn the market in the first 1.5 hours of trading we could see follow through if we manage to break 898 on the downside."
It seems the bears tried to make a run for it in the first hour and failed, giving the bulls a chance to take the market higher as we had anticipated. The close smelled of manipulation to take out stops and run all bears back into the cave for the winter months to come.
Today
Futures wise as you can see we already breached the high and now entered a new trade range on the upside. Now here is where it will become very interesting for the bulls. In the past the bulls were able to take the market higher on strong divergences and lower volume. We had strong level of resistance at the 880 range and the bulls managed to gap it to take the market to the next big range. After one month of consolidation within this new range the bulls are ready to take on very strong resistance. 200 dma, high of the year and the high off the previous bear market rally following the crash of October 2008. To successfully break this trade range and ensure this is not a fake break out volume needs to step in. In the past few weeks volume has declined and we have not been able to have a volume day above the 50 day volume average. Today will be a great test to see if volume can be pushed above that level for once.
I have been very strong in the past on the volume measurements we have seen and this has always been a major concern to me as we are increasing in price with volume becoming lower and lower. Of course one cannot ignore whats in front of you - regardless of the volume indicators prices continue moving higher. If one were to take out volume as a measure and only look at graphs we are seeing a breakout into a new range.
During this rally we have had 3 major resistance levels. The 741 that was breached like a "knife through butter". The result was a 60 point move towards the 800 key range. After a breach of this range we managed to find the top at the 880/8200 levels (80 points). We have spent one month in the next new range and have seen heavy consolidation during the last 50 points. A break of this next range, at the worst case should give us another 50 points on the upside if this indeed is a new range. During mid March I had jokingly referred to the 1014 as a possible target for this rally - it was so extreme to me that I had removed it right away from my trade targets but it seems this market only has one goal - higher.
If you would have told me 3 months ago that the day GM goes bankrupt we are ready to enter a new 50+ point trade range on the upside - well I would have laughed at you and told you to take out whatever funds you have invested and put it in a CD. You are the one laughing now and saying I should have followed my own advise =)
For the bears - quite honestly this is an easy trade here. While it sounds very silly and almost seems impossible to handle we have to consider where we are. The question will soon be answered whether or not this is a bear market rally or whether the 666 low was the recession half way point that I expected to occur at 480. We have tested the 200dma last year around almost the same time frame with the same exact volume setup we are seeing now. Additionally during our other bear market rallies we have seen many W formation consolidation patterns at the top or closely after the top that seemed to have given us the bullish breakout for 1-2 days just to reverse strong with above average volume stepping in.
As you know I have been quite a bear during this rally which not only has been painful but also dead wrong. My fundamental views have increasingly become more and more negative. Earnings of companies are at bull markets levels (some even bull market peaks) - a very strong move from one extreme to the other. This recession has shown us quite a few things - but one theme keeps constant during this time - everything is being dealt with on the extreme side of the spectrum, whether this is negative or positive.
Support and Resistance
956 = first step at half way point of new range
945 = Oct 2008 rally top
936-938 = the same range I have been referring to in the past. We have seen our first test at this range during overnight action here. So the chances for this to be re-tested is very high.
You already know the lower end numbers so I am just going to stick to new ranges today.
Scenarios
Ok we have quite a GAP to deal with here. Forget about my GAP trade lesson you can find on the right hand side. This GAP here will be very important and only gives 2 scenarios. Scenario one is the most likely with the Open price today being the low of the day (give or take 2-3 points) and a rally higher to close the day at 945 or the last resistance level of 956.
Scenario two would be a approximate 10 point drop within the first 45 minutes. After this we should see a rally attempt that should get very close the the intraday high making you believe we will continue on the upside just to fail a few points before.
The most likly scenario here is the first one with continuation from the Friday spike. If this is to occur you have a nice chance to get a reversal on Tuesday that should let us know where we are headed.
Subscribe to:
Posts (Atom)