Friday, January 30, 2009

Weekend Special: What has changed?

Lets first review the week. If you have not caught up you may want to read my 2 breakout scenarios posted this month.

1. Mid Term bearish play towards 640

2. Mid Term bullish play towards 1000

Both scenarios still hold true as we have no clear signs of either direction. Personally, I am leaning towards the bullish side for reasons I am explaining below.

Last week I had anticpated a breakout based off our long term falling wedge reversal pattern. The attempt occured just as I had described it as a 3 day scenario, however ended in failure with our reversal on Thursday.

While we are approaching the bottom ranges yet again our volume picks up drastically. This was clearly visible again on Friday this week. Any attempts on the upside are occuring on lower volume and are beaten down again by the bears. So what do we make off this? We continue to have bad news and fundamental concerns within the market place but are not able to break the market down further. Investors may be comfortable with this 800 range as a bottom at least for now.

We ended the week exactly as we started it - something I did not think would occur but this leads to further conclusions we can take. One of the key differences between this week and last week is our divergence on the MACD. We had negative divergence coming into the week and are now at zero. MACD divergence never stays at zero for long.

Our trade channel is getting narrower and narrower and the current pattern is coming to a completion. We all know long term pattners will give us great insight of things to come, especially one that has been building up for almost 4 months.

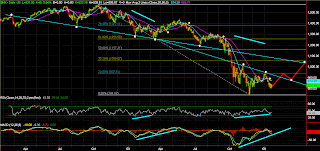
Now why am I still bullish while we continue to spend the majority of our time on the bottom end range. Take a look at the updated daily graph below for some insight. I have made some more marks at key points. Vertical lines whenever we have zero divergance and a 20 day moving average. Now the interesting thing is the comparison to our January to March 2008 time frame. We are setting up for an exact replica as you can clearly see.


Review the colored dots with the data.

Red = below dma, negative divergence, setting a low point in the market, recovery off the lows
Blue = reversed breakout above dma, positive divergence
Yellow * = above dma, positive divergence, reversals once we break below dma, uptrending MACD
Violet = below dma, negative divergence, large intraday ranges, test at the dma (wed this week) with a quick reversal down to the low ranges

* we have the exception of our Nov capitulation that created the low. How can we justify this key difference? - we were coming off one of the steepest down turns with VIX at levels never seen before and a fairly quick reversal leading to a rally from 740 towards 900 in just 5 days on extremely high volume. Is that enough to ignore or remove from this analysis? You be the judge.

Indecision in the market place is not easy to trade and you are always in conflict with either taking a quick profit just to see the trend continue strong after you exit or attempting to trade a trend just to see your stop loss take out your position that had strong gains. In hindsight we can easily explain and justify the moves that have occured but when you do not know the next 1 min candlestick it is difficult to make a trade especially in a market place that can snap any second - we have seen how violent those moves can be and they can come at any second. Do not let this month get you discouraged - it won't last and we will be able to trade with a proper trend again soon.

So in summary - we are well prepared to identify our next 8-12 weeks once the market gives us a sign. We have two scenarios coming into next week starting Monday with either one last day spent at our lows and possibly a dip into the 700 range that will quickly reverse as a v-bottom or a weekend surprise with a strong gap open. I for one am excited again to start February with a good understanding of where we will end up this quarter.

Kind of ironic that we closed the week at 8000 on the DOW. Will it be the last 8000+ close this quarter - or will it be the last time we almost dropped below 8000? We will make a turn early next week so be ready.

How many lives do we have left?

Yesterday
Well we had a fairly narrow range on very low volume without any real stops in between. If you review my support and resistance numbers you can see how they came into play but none provided proper support with only the 861-862 giving resistance in the morning before we broke lower.

Not holding the 850 range with at least some support is quite surprising but also shows that traders and investors are getting tired of the back and forth action and choose to remain on the sidelines.

Today
Its Friday today, end of the month, and we are back to where we started a week ago. My call for being 60 points away last weekend did not hold true and I can see ourselves closing slightly below the 840 today. I would expect volume to remain calm with a potential of a run into the high 830's.

Thursday, January 29, 2009

Fake or real breakout?

Yesterday
Well we did get our confirmation in style yesterday leaving the 850 behind with strong committment. I said yesterday the bulls need to make a stand here and they did. I had stressed the significance off the upper range that were closly bundled together from the 850 range towards 870 with many key points in the middle. The 861-862 played a big role and was the bottom at 860.09 right after we gapped open in the morning. We slowly inched towards the 868-871 at 869 in a narrow range until we had our breakout at 1:30.

If you look back at the post on Saturday I said the following:

The breakout can be confirmed using 2 possible scenarios. Either 2 very strong up days on big volume or the second more likly scenario is a strong day towards 857, followed by a distribution day possibly retesting the previous resistance range (840) and then a third followthrough day breaking the previous 857.

On monday we rallied towards 851 giving it the first test followed by an intraday retracement of exactly 50% (Friday low to Monday high). Tuesday we went through distribution with the low of 835.40 that I had called as the low before hand (833-834) and tests at the 850 that were a bit short. Yesterday we had the strength I was hinting at and we followed through breaking all major resistance points. Closing above the key averages of 870 (both 20 and 50) is quite a strong sign.

Now on the cautionary side - while it appears we did break through it was still not on volume levels that give me a 90+% confirmation. We did have a strong day but it was weaker then any of our days last week when we were trading in wide ranges around the 800. So be cautious here on entry for the long side.

Today
We gap opened yesterday without any attempts at a fill, considering the significance of the 850-860 range I foresee that we will see this during normal trade hours. So wait for this retracement to tell us if this was a real breakout.

Looking back at the post from Saturday take a look at the first graph and look at the Nov high and Jan high trendline. Looking at where we are now this trendline will bring is to around 900-904 which we remember as a key resistance range during our early January trade action.

How to trade this?
Well we did get a strong move over the past 3 days so here we can take a breather now and let the market tell us what to do. Remain on the sidelines until the market has settled down and absorbed this move.

Wednesday, January 28, 2009

Well are we convinced?

Yesterday
We did get another push, however momentum and volume was lacking yet again, however we are on the upper end of key resistance areas that is being approached on an ascending triangle so be cautious on the short side.

I am glad my call for the low worked out. I had mentioned that if we are to retrace we should not get back to the previous days low and stop at the 833-834 range - the low of the day ended up at 835.40. I was looking for a close above the 850 range and we did not quite accomplish that but we edged a bit closer.

We are increasing in price as volume is declining so be very careful on both sides of the trade. The bulls do have a chance here to step in with volume as they are only a few points away from key resistance areas.

Support & Resistance
I am going to focus on the upper areas today. All of the next resistance lines are very closely bundled together so be careful here.

868-871 = key areas for 50 and 20 dma

861-862 = the last big bottom before we dropped below the 850 range.

857 = you remember the significance of this number previously. I do believe it will come into play again

850 = upper edge of our 2 day ascending triangle with a close just 5 points away

839-840 = we know the importance here, it took quite a bit of work to get this broken and it still remains a weak support point.

833-834 = this should be our last barrier before the 820 though it is my feel that if we are to revist this point we can end up at the 829 instead as it carries more strength.

Unfortunately we have many resistance areas on the upper range which makes it difficult to trade in either direction.

Today
We should see quite a strong day today. We are on the third day of our important "breakout" so we need to follow through. We are making new peaks, or at least testing the upper ranges while momentum is dropping. Bad Sign so the bulls need to make a stand here.

How to trade this?
Today is going to be a bit more difficult. I would remain on the sidelines yet again unless we hit the 870 range. Here we can easily go short however I do not believe this will be reached today. My call would be a stall anywhere from 857-862 but again, difficult to trade unless you can closly watch volume and time.

Tuesday, January 27, 2009

Almost made it ....

Yesterday
Well the morning was setting up like a text book example. We had our rally off the open, retraced slightly and came in with strong buy volume. After having reached 850 however weakness set in. We traded closer and closer to the 840 that I thought was going to hold and broke for a 50% retracement. While this is to be expected and normal I would have liked to see more strength especially in the late afternoon. Closing below the 840 shows that the bull needs to come up with some more strength in order to continue.

From a trade perspective, I traded just a little as I saw the weakness in the market place. However those were very short term range positions. Sometimes its best to wait and see what the market decides especially with the action after 3:00 which clearly showed further weakness.

Today
We we are technically in an uptrend now so we need to ensure we will remain above the 840 and give the 857 a test here. Since we did not have the strength yesterday we can still follow up today with another up day, something I believe will occur with a close between 850 and 857.

How to trade this?
We have some great trades ahead of us again. We have the 840 range which gives you great protection but gains are limited. If we break 840 on the upside best chance is a run to 850, potential 856-857 so its 10-15 points. A break below the 840 will get us back to yesterdays low, though it is my expectation if that is to occur it will stop at the 833-834. A break of this range will of course bring us back to 820. So we have good potential for trades here today.

So keep those numbers in mind for today, and stay cautious. We still have potential to go into either direction though it is my feel we may test the upper ranges of the triangle I had shown on Saturday.

Monday, January 26, 2009

Sitting it out ....

Previous Trade day
Well the market gave us a repeat and traded yet again between the 804 and 840 range. Another sideways day on strong volume.

Today
I had made a special update this weekend after my weekly analysis. This is quite an interesting turn of events and could be setting up for another big run to the upside. The market has held the 800 range much stronger then I anticipated. No matter how bad the news is the market has gotten comfortable and has set bad expectations regards any fundamental piece of information. We seem to be taking the attitude of bad news being priced in and investors running tired of having further drops.

I have to admit, its the first time in a while I am not 100% confident of a move into either direction. Back in July 2008 I was afraid of strong down moves and went 100% cash in august while we were still uptrending - while that gave me great protection for sep/oct I tried catching the falling knife in heavily oversold conditions just to see it drop further and still managed to loose quite a bit of money. In november I was confident of the bounce of the 760 range even before the confirmation was in with a rally that will last till January. In december I was strong on hitting 945 for a great short down and it occured - now what will happen next?

All I can say is we are well prepared, have worked out all our signs and are now just sitting and waiting for those signs to occur. If you ask me where we will turn? I do not know, the primary trend is down and I am confident we will close the year a lot worse then we started - however, asking me where we will turn next - I will not be able to answer but I tried my best to provide enough information for the market to tell us.

How to trade?
Due to our indecision I would remain on the sidelines, any trend that will develop will retrace so do not try to chase it. I would be very cautious on both sides of the trade today, long and short and do not make the mistake of looking at the past 4 trade days and blindly going long off the 800 or short off the 840. This is doomed for failure today. Watch volume carefully if you are to enter any position.

Saturday, January 24, 2009

Weekend Special: Do I see a bull in the woods???


Well guys, I promised to be more objective yet again so here we go. I have spent some time looking at what we have gone through in the past few months and made an interesting observation. At first it seemed we were creating a descending triangle however after the strong support at 800 I went back to the drawing board to determine why this may be occuring.

As you can see we have a typical long term falling wedge reversal pattern forming. We have some slight violations, one on the RSI level with the breakdown below 850 however our MACD, volume (not shown), price peaks and lows are giving us signs of a strong reversal. As you can see from the trendlines I have drawn we are at the edge of a breakout point to the upside. I also added a second trendline that ignores the christmas action as this was quickly reversed and occured on very low volume - it was meant as a reference only but it aligns perfectly with our lower highs.

The market cannot sustain this wide range sideways pattern for long so I am looking for a decision yet again. I had mentioned that the 800 should provide a short term bottom and it has done so much stronger than I anticipated. The breakout can be confirmed using 2 possible scenarios. Either 2 very strong up days on big volume or the second more likly scenario is a strong day towards 857, followed by a distribution day possibly retesting the previous resistance range (840) and then a third followthrough day breaking the previous 857.

So it seems that after the bull has been beaten out of me it suddenly reappeared. I had updated my long term outlook this week and this still holds true if we are to break the 800 by next week - so do not count this out - one thing we can definitly take out of this, by Friday next week we shall be at least 60 points away from our Fridays close price.

Additionally our 50 and 20 dma are at exactly the same points now giving us another confirmation of a decision at our door step. The last week of december and first of January represents the first time since June 2008 that we have spent more then 3 days above the 50 day moving average - now this was occuring on very low volume so its not enough of a confirmation however something to be considered.

Here is a longer term graph. I drew an interesting trendline marked with white dots - this would play in greatly with the upside reversal. The yellow dots are 20 and 50 day crosses whereas the last 2 support further drops in the market place. The redline indicates a potential setup for this uptrend with a top in the 1000 range.
Also take a look at RSI/MACD. We are trending down on the S&P while we are trending up on both indicators.

Friday, January 23, 2009

Decisions Decisions ...

Yesterday
Yet again another strong range day however there was not much that was easily tradable. Sideways action after a big gap down, indecisions around support and resistance points and an attempt at the 850 that fell short at yesterdays top. While we sold off we closed slightly above the gap open. I would not consider yesterdays action a proper fill off the gap as we closed below the previous open but it was another attempt at key resistance.

I had mentioned that the market needs to reattempt the 850 range before it can properly break down further, something that I feel will occur in the short term.

Today
We have friday today and as always weekends carry a lot of risk for us and many other traders feel the same way. We have to watch action carefully in the last hour of today - a rally even if its below the 850 will confirm that we will get our retest next week. A sell off will give us confirmation for retesting the november lows. I do not feel we will see a 850 test today but we have been trading rather sideways the past few days. The market is either trying to create a base here or absorb buying pressure to drop further.

You can clearly see that the market is preventing the big breakdown to come as a break of the 800 will lead us to new lows. While there is one last chance at a double bottom I feel it will be too late.

How to trade this?
Today is probably best spent again on the sidelines - yes we have wide ranges but no current trend - we need to get out of our sideways action and continue either on the upside or downside. If we are to reach the 850 between 11:30-12:30 we have a great trade on the short side. If we get to the 850 in the late afternoon after 2:30 I would avoid this short trade as you may have to carry it over the weekend to get your exit.

Thursday, January 22, 2009

Jump Market Jump

Yesterday
Can someone say ranges are back? ~70 point range yesterday if you include the gap open. That should account for the 60+ range days I hinted at. We violated the 820 in the morning and dropped straight to the 800 support and formed a double bottom. Look at both charts on the 15min from yesterday and the day before - you can flip them on top of each other and they are identical. Now I mentioned that 800 should provide quite a bit of support and we rallied without any turn into the close - almost 40 point rally. However, while we had a strong day yesterday I did not see the volume I was looking for to make me feel a bull again - but as mentioned from now on no more bull/bear attitude. Most of this rally was spured by the severly oversold financials - this was the driver and nothing else. Looking back at the past 18 months you can easily see how any rally in financials was very short lived - nothing has changed for them with the exception of new 52 week lows.

The lack of sell volume and drops off any of the support ranges was a clear sign that the short was best left on the sidelines. I did attempt a short at the 822 range and quickly got stopped out. After this was broken we continued strong on the upside without any more hesitation.

Today
My anticipation is a continuation in the morning hours to get back to our key support at 848-852 (potential of a 857 run up). Keep in mind we have not given this range a proper test as resistance after we had broken it. Even if we do not see a continuation in the morning we should retrace with a max of 50% or maybe only the 38% mark and then reattempt the upside of 850.

So watch volume carefully as we sell off and continue as this will be a clear sign.

Special Note
I wanted to thank "tr" for the link he provided with the analysis of the VIX. http://www.stocktiming.com/Wednesday-DailyMarketUpdate.htm A very interesting way to analyse what we have stated already. It definitly supports what we are going through and will go through. The site clearly identified that we can either create the double bottom of our lows in November or enter a very drastic down move as I had outlined yesterday in my long term review. The financials have given us a sign by having had severe losses this year already. Also yesterdays rally fits perfectly in with the VIX analysis. As we are widening the range of the VIX we need to retrace back to create the higher low. This was clearly done yesterday and supports the sites point of view. Even more so it is a great piece of information for us to analyse the rally that occured yesterday and put it in perspective.

How to trade this?
Well todays review already shows what my expectations are with the most likly scenario of a continuation to the 850 range. Here we have a great protective trade ahead of us again. Also, with ranges coming back I cannot stress the importance of stop losses enough. You do not want to end up on the wrong side when we have a 30 point move. Cut the loosers and let the winners run out. The other thing you may want to do on those range trades is trailing losses.

Place your order, enter the stop loss, once you are in the proper trend and you have your first greens change your stop loss into a trailing order starting at break even price. This way you can maximize your gains, limit your risk to break even and remove the emotion out of the trade "ohhh I am up let me sell" - there can still be some left as was clearly visible yesterday coming off the 800 range - something that even surprised me.

Wednesday, January 21, 2009

The turn has begun ...

Guys, sorry again about the short post yesterday but I was quite busy with work (yes I do have a full time job that does not involve trading)

Yesterday
Yet again another Obama reaction so it seems. First the sharp drop we had off the 1K range when he was elected and now another 5+% down on his first day. Great track record thus far - though lets not be hasty and blame it on him - financials continue dragging down the markets and more and more talk of nationalization of banks brings even more fear into the economy.

As you could see we broke through the 820 range and never looked back. I anticipated some support of the 812 range but there was none and we headed straight for the low 800 range.

Support and Resistance
Well as we are entering new ranges let me give you some guidance here as well.

820 = We all remember our key support at the 820 range, this should provide strong resistance now but expect that it will trade back into this range. So be patient and do not chase the short from here.

798-802 = the market likes round numbers so expect this to be the bottom for the last rally to the 820 range

782-784 = while there is quite a gap this should provide some short term bottoms and great way to take some profits off any shorts to re-enter at previous level

764-770 = yeap this is major support as the 764 represents our dot com bottom

739-742 = the lows we have established thus far

Mid & Long Term
Well unfortunately I was not able to throw this one into the bin. I have talked to some of you about the 5 wave theories in technical analysis and not rallying off the 850 range unfortunately puts us in a very negative pattern.

Of course we will reattempt the lows from here and there is a potential of a double bottom but this should be short lived. I expect us to re-attempt the lows very soon and could reach it by early/mid next week. From here we have a quick bounce but do not expect more then 40-50 points. Once we break into the 700's we shall remain there and below for some time to come (exception of course the bounce off the 798-802 range).

We will be creating new lows in the next 8-12 weeks and should find it around the 620-640 range - by new lows I mean at least 50+ points away from our current low. Be prepared for wide ranges and instant snaps in the market place into any direction - we should get back to having 60+ point range days which are perfect for us to trade.

From here we could also be setting up for the final bottom, something I do not expect before summer but we have to be cautious - the market had a chance and did not make it - we could be in the 460-480 range by June/July which should represent the final bottom in the market. If you go back to my long term posts in October 2008 I had stated that the bottom should be towards the end of 2009 so this is a correction due to our current conditions.

Special Note
I wanted to explain my bullishness over the past 2-3 weeks. As you can see I have been hoping for the market to find means to continue on the upside and unfortunately my trading attitude has suffered as a result. In the past I have looked at the markets in a very neutral fashion and always had both sides of the trade as a 50/50 change every day. However my bullish tendency has caused me and us to loose great trading opportunities in the past weeks. Yes as a trader I do not care where it goes I just need to know the direction and you make money - however, as a person that is dependent on the economy to make money I am looking at a pretty negative picture. As I stated yes we can make money off those ranges but what good will it be if the world economies will continue on its down path. I will try to remove those emotional aspects yet again from my posts as we now have our confirmation.

How to trade this?
Well as you can see the short represents the best chance at gains here so watch your entry carefully. If you want to trade a sure thing stay on the sidelines until we have hit our bottom. No need to always trade. If we do have a chance to get back into the 820 range watch volume here carefully and we can enter our short from here.

Tuesday, January 20, 2009

Turn around?

Short Post Today sorry guys ....

Previous Trade Day
As mentioned I expected a retracement however more along the lines of 50% or even 32% - retracing back this much is a fairly bearish sign - yes we did make up a lot in the afternoon but we should not have traded back into this range after having hit the 820 range.

The one thing I am glad at is our ranges. The past 2-3 weeks have been difficult to trade unless you were totally short or totally long. With ranges back we can easily justify entering short term positions for a 10 point gain.

Today
Well we have Obama in office, we had a day off and closed in a fairly decent range - in my post on thursday I had mentioned that the top could be around the 880-885 range. The trade day on Friday confirmed this assumption as we needed a follow through day that we did not get.

How to trade this?
We actually have a great short term trade ahead of us right around our upper range from Thursday/Friday. Watch volume as we re-attempt the top of Friday and either go long or short. This will give you a great protection and some nice gains of at least 10 points.

Friday, January 16, 2009

Are we going to follow through?

Yesterday
We saw quite a turn around day yesterday thanks to our 820 support range. We had hit the first low of the day at 829 (828.91 off by 9 cents). I had posted in the comments any longs should close out here as we will drop lower. We then went straight for the 820 (819.99 off by 1 cent lol). As you could see we rallied but I was getting concerned as the moves lacked any momentum. We had retested the range and broke into 817.04 which is halfway between the 820-815 range that I stressed was acceptable. Here is where buyers stepped in - highest volume day this year and one of the highest volume days thus far in the past few weeks. We hit the 850 range throughout the day with a nice test at that range. I had closed out my long here to protect the gains. I was really hoping to see a break off that range and close right at it or slightly above.

Today
Of course expect a follow through day and another test of the 850 range which is very close. We need to break this range on the upside to be able to sustain a continued rally. The bulls yesterday gave us a glimmer of hope that we need to continue today. So lets make sure its not a dead cat bounce.

How to trade this?
I would place my trades around the 850 range today. Both long and short carry great protection and both are 50/50 - while we had the volume yesterday I still would ask for caution here as this could be topping out soon. Again the best advise for today is to stay out and let the market find its tone. We need strong volume today and a close at least 10 points above the 850 range. That will make me a believer again so we shall see.

This could be setting up like we did off the lows in november so be ready. Wait for any continuation, then try to get in on the retracement back down to previous resistance ranges that should now be support. Here we can enter with a fairly tight trailing stop loss and see how far it will take us.

Thursday, January 15, 2009

Are there any bulls left here?

Yesterday
I had added my cautionary notes in the comments in the morning hours due to our drastic pre-market moves. The call was either for a v-bottom or an ugly day - well we had an ugly day something I would not have expected. As you can see the 848 should have been the turn around - we stopped at 847.92 after the gap open and attempted to hold this range. Here is where I went long. I had stressed the importance of volume and you could clearly see there was none setting in - I closed out the position after 10 minutes - while it was in the reds it was a good protective trade.

As you can see the past 3 days I have been rather bullish assuming a rally and staying one way in my attitude. This is the same hopeful perspective many have in this market place and I was warning everyone about. One of the main reasons for this is my fear of the cycle we are about to enter which can be very dramatic and very bearish leading to new lows in the short term. I am a bit surprised to be honest we have traded this low in such a short time frame - it is definitly setting the tone of things to come.

The rest of the day was driven by fear with minor attempts at recovery. Higher volume than yesterday which is a good sign for us traders as we will have much better ranges ahead of us for trading. I am going to use a quote that many of us have heard already - "be fearful when others are greedy and be greedy when others are fearful" - I think that by itself says enough.

Today
Well from a technical side we are very oversold but take this with a bit of caution. We need to account for fundamentals as this is the fear driver at the moment. Purely technical take a look at the bollinger bands on the daily - we have sliced through the lower range yesterday and as you know this will call for a reveral but it may not be time yet. We closed below the 850 range at 842 and are 22 points away from major support. I am going to make a statement now I normally do not do - we will see a bounce from the 820 range.

Take a look at BAC, AAPL and watch JPM earnings today - those will be drivers for todays tradeing.

Support and Resistance
As we have entered new ranges its time to present some more numbers again.

880-885 = we know the importance of this range - if we are to get a rally this could be the top but I think we will stall before then.

870 - 871 = another mid point of lesser importance but something to consider in order to get into the 885 range

865 = this should be the top from our rally as we have broken the 850 on the downside

848-852 = this will be the key resistance to break on the upside if we are to see any further highs. It should be broken for a short time frame but may not hold.

836 = yesterdays low but its more meant as an orientation as it does not provide strong resistance nor support. The proper support level is in the 829 range which is 7 points away.

815-820 = this will hold as it provides major support in this range. We have only traded below this range for a short term in this recession so it will provide enough support for a small rally.

Long Term
We are about ready to have everything in place to make another long term call and properly fine tune my October and November calls. I apologize for not making this earlier and waiting so long. Thus far I have been correct with those calls so I want to keep that track record as you may understand. The other reason is that I am fearful myself of the cycle that may be coming and want to hold off as long as possible before giving such bad news. We have the potential of possibly 25+% drop from where we are now (842) in a fairly short time frame. Before making a statement like that I rather have all my facts in order with the proper justification.

How to trade?
Well as you can see I have been rather bullish and keep stop lossing out of my longs. Yes I did have a bad beat 2 days ago but lets scratch that one off the list as it was one of those days you wish you could remove from your trade log. Keep in mind while we have been trying to go long we had great protective trades thus having only minimal losses.

If we are to reach the 820 range which is very possible from here we have a long opportunity however we also have a wider risk range. Anywhere from 830-815 is an acceptable range for a long entry so build your position slowly instead of going all in.

Shorting again I would avoid as we can snap at any point from here making your shorts risky and require constant monitoring.

Wednesday, January 14, 2009

Sigh ....

Yesterday
Well the market tried its best to make a decision yesterday - highest volume day this year. On Friday morning I had called for a change of trend between 10:30 - 11:30. We did change trends into a sideways trend yesterday - however this is something that normally does not happen. I had posted on 11:31 saying that the breakout and trend change is imminent and 5 minutes later volume picked up. If you look closly at the 1min bars at 11:45 you can see some nice wide ranges with volume - this is where the market needed to break to the upside and it almost occured. While I am glad this call worked out it does not provide a great trade opportunity. Many times sideways action is distribution to absorb buyers/sellers (depending on trend) and then enter a continutation pattern.

Yesterday was a classic bull/bear fight - volume on both sides was equal and we closed the day the same as before. This is a classic sideways sign. As I said we needed a breakout to the upside that did not occur which is a bearish sign. The market lacked the momentum to create the uptrend. To top it off we did not reach my 850 range either - my feel is that the market needs to hit this important support before it can create an upside swing.

Trade Lesson
This one today is just for me. I had a rough day yesterday and regressed in my trading to levels I never thought would re-occur. I was a total beginner yesterday - overtrading, chasing trades, completly ignoring entries, stop losses. I reviewed my trade log at the end of the day, something I do on a daily basis to ensure I trade with proper risk and money management and was sitting just amazed at what I did.

It started off with opening the day with a bad beat. I had entered an alcoa straddle just before close anticipating a strong move just to find both the call and put deep in the reds at the open. That set the tone for the day and for some reason the typical beginners attitude came back "let me try to recover my losses today" - we all know how deadly this attitude can be. No matter if you have a loss or gain - after every trade you start fresh over as if it were the first trade after a 3 months vacation. I had recovered most of those losses by getting lucky trading the ranges (yes lucky as those trades lacked any dicipline). I was almost break even and wanted to close out the day in the greens - I got more risky, used more money and higher leverage and of course got beaten down. Had one of the worst days in 2 months yesterday.

So the advice out of all of this - stick to your trade style at all costs. If you do not get the entry you are looking for have patience and stay disicplined even if that means not trading. And the most important lesson - every trade you enter is a new trade that has no relation to any previous trades you made. I hear many people saying "let me just do this, if I loose its ok as I made money on the last trade" - very wrong attitude - what will you say if your last trade was a loss and the one before, and the one before? Every trade you enter you start with a clean slate.

Ok this lesson was really just for me as a reminder ...

Today
We had our stop yesterday to the downtrend we had created off the 945 peak. Not rallying at our change of trend point yesterday has me a bit concerned and is a clear indication that we will not reach the 945 again on this cycle. The bulls have waited patiently to make their stand and stepped in yesterday just to end the day in a draw. This shows immense selling pressure in the market place with anticipation of further declines.

While I anticipate we will see the 900 range again in the next 6-7 trade days it should remain as the top there and then decline again.

How to trade this?
Due to our draw yesterday I would recommend sitting this one out to see if there are any bulls left in the market place that can push the market higher. If we are to reach of the 850 range we have a great long chance again. 862 yesterday was very close to this range so watch volume carefully as we break yesterdays low. On the short side - we could see the resistance levels as we have stepped down. 871 and 877 are key resistance areas that could provide short term shorts - the key here is on volume and how we arrive at those numbers. Both of those shorts carry a bit more risk then I would like so be cautious at those levels - technically we are still in a bit of an oversold condition.

Tuesday, January 13, 2009

Time is up ...

Yesterday
Well another steep down day. After breaking the 885 range in the morning hours the market continued its slide without any type of rally. I did try to play the long side yesterday at the 880 range and had to close out in the reds after it was clear we were not going to rally. As I mentioned a break of that range will bring us back into the 857 range - however keep in mind this was not a shortable down run as we are quite oversold at the moment.

Today
Well time is up for the market and we need to make a decision today. On Friday I had called for a change of trend in the morning hours today so lets watch the morning action carefully. One thing to look for today is volume. Yesterday it was very clear and easily visible how the market traded - looking at the 1min spy bars you can see how every strong move was only apparent in the down bars and any minor rallies were beaten down as they occured on lower volume. So watch for those signs today and wait for momentum to step in here.

Looking at the daily S&P chart we have 0 divergence on the MACD, 45 on the RSI (which is pretty much 50/50) and momentum pretty much in the smack center as well. We have spliced through the 50dma and 20dma so we need to make a move above this range in the next 2 days.

We are technically still in a mid term uptrend so we need to make a decision here today or we will continue on our slide back and resume the primary bear trend.

How to trade this?
Of course the short side carries tremendous risk here so stay away. On the long end I have to emphasize again that we have a great chance if we are to reach 857. Even if the market is done on the upside we should see at least 20 points off this range. We had hit the 864 as the low of yesterday which is only 7 points away from my target - yes we rallied into the close but this was short covering as many shorts want to look in profits before alcoa earnings.

Keep in mind we can overshoot the 857 so my final call for the low would be in the 852 range so watch volume as we step into the 850's to see if we have buyers step in.

Good luck today for everyone. I am pretty confident we will get to see a great trading opportunity today with a very high risk/reward ratio. If you have any questions during the days trading please post them up in the comments and I will try to answer them as quickly as possible.

Monday, January 12, 2009

Still no decision

Previous Trade Day
Well I have to admit I was quite surprised at Fridays trade action. We had a very strong move in the morning hours as anticipated but the remainder of the day remained very tight. We absorbed the unemployment which turned out to be a number many expected - that by itself can be a good thing sometimes. However, after the initial drop nothing happened. I would have expected much stronger moves throughout the day but we did not see anything that would resemble a decision for a trend.

As you saw in my note I would not feel comfortable holding over the weekend - I guess many others thought the same way and started pusing the sell button just before the close. We closed right at the 890 range which is my confirmation for a break for the downside - however we did not break it - we had a few points below at the 888 but went back into the close. The market is trying its best to avoid a breakdown off this range as it will accelerate selling.

Today
Earning season starting again with many expecting horrific numbers. This in fact could help the market in case any - even if its just one out of five will report numbers that are better then expected - kind of like "I only lost 3 billion this time and not 3.1 like last time" =)

Just as we rallied off our lows in November the market is looking for any excuse to buy. I still feel we have one last push left in the cycle, however we have to account for the fact that the top may already be in.

Mid Term
As we have a few new readers here I would ask you to read my older posts as well. This one was done back in October giving you a long term outlook http://chaugner.blogspot.com/2008/10/where-are-we-headed-long-term_29.html

The other one in November when we had created the lows http://chaugner.blogspot.com/2008/11/is-this-bottom.html

When looking at the daily chart of the S&P we have a very strong reversal signal building. While we are creating higher peaks our momentum is dropping and creating lower peaks - this is a very bearish sign and considering this is a 1+ month pattern we have to be cautious for a rapid drop back to retest the lows.

The market is currently setup to give us one last push. This is also driven by Obama with the hope of changes and leadership that could help us out of this crisis with a black eye instead of broken legs. But I think many of us know this one will break legs - denial sometimes is the best thing you can do after severe losses. Consider this - you have lost 50+% of your money that you have worked very hard for in the past 5+ years - poof and it went away. Many do not want to accept those realities and continue life filled with false hope. Ok back to technicals as we could be sitting here for hours analysing how we will continue.

How to trade this?
We will have an opportunity with great protection to go long at the 885 range as a break into 870's would signal a run to 857. However, as you can read in my mid term review it will be difficult to justify holding this for long. On the short side I would be cautious as we have dropped quite a bit quite fast. We have some very short term opportunities at the 900 and 911-912 range but those could be broken if we get the hope of better earnings results.

Lets try one of the hardest things to do - patience. Wait it out and see where the market will take us before entering positions. Maybe I have become too cautious of the enviornment but please bear in mind where we currently are time wise. We need to know the mid term direction of the market to be able to properly hold positions - and at the moment we have none so waiting on the sidelines and staying small in your trades is the best advise I can give.

Friday, January 9, 2009

Where will we turn?

Yesterday
As expected we did have a narrow range and held the important 900 range, while the low of the day was slightly below the 900 at 896.81 we can consider this still as part of the 900 support range. I mentioned we need confirmation of a break at 890 and that did not occur.

Regarding the comment of the need to go through distribution. I had mentioned that the 900 range is very important and can provide a short term bottom. Considering the strong down day on Wednesday and the importance of 900 a break here was less likly. The market is still trying to find its direction and the down day on wednesday required either a decision yesterday or another day of holding/distribution. Also take a look at how we arrived here off the 857 low, it took us a bit of time to get into the 945 range and to finally find the top there - the market is not going to give that up so easily. There are many new believers out there that feel the bottom is in.

As you can see the advise not to short again on wednesday turned out to be correct. Yes I know its always easy to state that after the fact, though it seems this time it was correct.

Today
I had mentioned that the retest of the 945 range on the intraday tuesday was quite a bullish sign. To top it off we did not break 900 even with horrible retail results accross the board - to take it even further we broke out of our narrow trade range at the end of the day and closed above the range - while it was only a few points it is still a bullish sign. It is very likly that from here we will reattempt the 945 range.

While it is Friday the market is bracing itself for the Jobs Data today. This will be the key driver in deciding our direction. We are currently still in hold mode, though with a slight bullish tendancy, so this key fundamental indicator will define our trade range. This direction should find its end on Tuesday between 10:30 and 11:30 and change trend there so watch for a top/bottom next week.

How to trade this?
I would try to stay out of the market today even with strong moves we will see. Remember we do not gamble so we want to ensure a tradable trend is established. If you are to dable in the market today stay small even if it appears tempting to be part of the move today and refer to my key support/resistance numbers at 885, 900, 912, 920. A break of 885 is very bearish and will bring is back to the 857 range. A break of the 920 very bullish leading back to the 945.

Its Friday and in this market enviornment I would not feel comfortable to hold over the weekend. We will have a much better chance to enter a position on Monday as the market will reattempt upper/lower ranges giving us a great 2 day position to run it out by Tuesday.

Thursday, January 8, 2009

ok what now?

Yesterday
Ok we gap opened fairly low right at the important 920 range, and continued straight to the next support point in the 911 range with a low of 912.50, from here we got the bounce I was talking about with a re-attempt at the 920. If you had closed out your short at the open you had another chance to get back in on this attempt. I said that if the 920 will be broken we will also break the 911 range which occured. I had mentioned that the afternoon will be important as we had a chance to setup for a rally here but we broke the 911 at 13:45 and never looked back to go straight for the 903-904 range with a low of the day at 902.37 during the afternoon hours.

We all know where the 903 range is coming from but lets make another simple calculation. 857 low to the 943 peak is a total of 86 points, 50% of that is 43 points. 943 - 43 = 900. You can see how important certain retracements become. Also round numbers present fairly sentimental value as well and markets generally trade towards and around those.

Trade Lesson
Many had asked me througout the day if it was a good idea to short again and I advised against it, unless you got in at the 920 in the morning hours the afternoon presented only a high risk short opportunity. Consider this, while we had a strong day our trade range througout the day was less then 20 points - not a lot to gain there.

Maybe I can use this as an opportunity for a quick lesson - do not overtrade - a mistake many make, me included.

When you come off a strong gain you want to get back in instantly to make more - the majority of the time you end up entering high risk positions, with very limited potential for gains and end up closing out in the reds or only with minimal gains. Rationale goes out the window and you do not evaluate positions with proper risk/reward ratios and stop loss protection. When you have a 45 point run and you are able to get 50% out of it you should consider it a very well executed trade, let the market trade itself out until a new trend is established. For short term traders (which are many following here) the entry with the proper protection becomes very important so do not forget that. If you are more mid term (1-2 weeks) then you are not reading my blog daily and you do not care if you have to carry a position in the reds for many days or even a week. Entry here is not as important but the exit is.

The market presents many opportunities for us. In a given week there are probably 2-3 low risk trades that will give you great protection and a nice risk/reward ratio, probably in the area of 1 to 4. There is maybe one big opportunity a month where the trade presents virtually no risk and a large amount of gains with a risk/reward ratio of at least 1 to 6 or even higher.

Be patient, control your emotions and evaluate risk.

Today
Well we went a little faster then I expected. Considering the strong day we had yesterday it becomes clear we have a chance at the 885. I said the 903 should present a short term bottom but I think we can see a break here by tomorrow. I anticipate it will take a bit more effort to break this number with at least another test before the break.

We will need to go through some distribution here first so expect today to be a bit lighter with a narrow trade range of 20 points max. If we are to see a strong day today the 903 may be broken ahead of schedule. This break will lead us back to a great trading opportunity.

How to trade this?
Well, today is time to let the market play itself out a bit and let it find its direction. We have a few trades available on the edges. First one would be a short at the 913 range with a potential of a run towards 920. I would probably try to stay out of the 913 as it carries a bit too much risk. 920 presents a much better short but it may not be reached today. I would try to avoid any other shorts today even if we break the 900 range as we need to wait for the 890 before we can confirm a break - and that is only 5 points away from the bottom, not enough gains to be had there.

On the long side, if we are to get a strong down day we can enter a very safe long position at the 885. You can probably start with the first entry at 890 and then wait for the 885 or even lower 880 if it overshoots a bit. If this is to occur in the morning hours we have very little risk, in the afternoon we have to be a bit careful and it depends on how we setup to get to this number.

A bit longer post today then usual but I wanted to emphasise the importance of overtrading (maybe I just needed it hear it myself again).

Wednesday, January 7, 2009

Nothing left ....

Yesterday
Well, the morning played out as we all thought it would, break of the 935 in the morning hours with a peak at 943.85. We did get a strong sell off from this point but bounced off the previous close price - I have to admit I was surprised at this action especially with a retest in the afternoon - this showed quite a bit of strength left in the market place.

Today
Time is up for the up move, we did have a retest at the 945, something I did not expect and needs to be included for further analysis as this was quite a bullish sign in the mid term. From here on out we should continue on a counter move to the downside. The trade action towards the afternoon will be key today in deciding where we are moving.

Short Term
We have created a nice trade channel now and in my opinion have reached the upper end of the range. The next few days will show if we can sustain the uptrend with a potential bottom of the range at 903-904. Depending on volume we may have a chance to get back into the 885 range but this is something we need to watch after we have broken current support. Here are some of the numbers again in summary that we need to break on the downside.

918-919 - there is a lot of support in this area as this has been the upper edge of the months ascending triangle off the lows.

909-911 - next step down that should be broken if we break the previous point but expect a bounce.

903-904 - again a strong support point that requires some work to get broken. This could potentially be the short term bottom leading us back to a retest of the 945

885 - breaking this could be considering a violation of the up trend and may lead us back to retest the lows.

How to trade this?
If you have no position in the market I would try to remain on the sidelines, I do not believe we will be able to re-attempt any of the highs today. The existing shorts of course have a great way to play out the position and lock in gains. 945 represents a perfect short position with maximum protection - something we always look for. Depending on your trade activity and risk management the 918-922 range may present a way to take off some of the short to lock in profits and protect the gains. You can either re-enter once support is broken or if we get a bounce.

If we are to get a strong down day look for the above support ranges to enter some short term long positions, those should give a 10-15 point gain but carry a lot of risk.

Again as mentioned the afternoon will play an important role today.

Tuesday, January 6, 2009

Still pushing ...

Yesterday
Surprisingly yesterday turned out as expected. I had hinted at the 918 now being support with the low of the day at 919.53. Many of us went short yesterday with the anticipation of a breakdown - something I advised against but I did not listen to my own words either. We now had quite a few tests at the new high at the 935 range, this makes this trade a little easier however there is still room at the upside with a 945 final test.

While we closed in the reds we were able to hold on to gains, close above the 50dma and close above the important 918. All those signs make me blieve we have one last run left in this rally before breaking down.

Today
We have one last chance at a break of the 935 which should occur in the morning hours. We are right on the edge of a break to the downside as momentum is making lower peaks while we are creating new highs. If we are to only get a test out of the morning action we should see ourselves further in the reds today.

How to trade this?
Well, as mentioned I could not resist the temptation and entered a short position at the 927 - considering we have a chance at the 945 its not a great entry but will pay out over the next 2-3 days - however gains now are limited as we could have a better entry for the down run.

Anyone who is still waiting on the sidelines has a great short opportunity today with half position at the 935 and leaving some on the table for a potential 945 run. Of course the long play carries way too much risk with very limited potential so stay out of any long attempts.

Mid Term
Going back to my posts at the end of november I am glad the overall market did exactly what we thought it would - even as far as calling an ascending triangle with a final break of the upper range. I admit I was a bit hasty to call the rally over when the first GM bailout failed but it shows even more the markets committment to rally besides the bad news. We have broken 9000 on the DOW which is a fairly sentimental number - you can see the appetite for bargains coming back in - many have asked me "Should I buy this? or this?" and I refer them back to my previous posts - people are believing this is over and looking for opportunities to not miss out on this up run - be careful as this is a short term rally that will come to and end soon. My calls at the bottom were for this rally to last towards the end of the year and possibly into January with a potential peak in the 1000's of the S&P. We can now clearly see how this is possible. Use this as a mechanism to minimize your exposure to stocks and other riskier long term investments and try to preserve capital as much as possible.

Monday, January 5, 2009

Happy New Year Everyone

Past Review
Well what happened here. After hitting the 857 range again I was confident of a break lower and instead we had a straight line to the top. This up rally had occured on very low volume on as volume stepped in I was sure of a break down on every peak - as you can imagine I kept on trying to short without luck - thats a perfect example of why waiting for a confirmation is a better trade many times. Friday was topped off on much stronger volume and a final break of the 918-920 range. I have to admit I was quite shocked to see this occuring, we had no retracements of any kind on the run up - something I had not see this drastic before, considering we moved almost 100 points up without a single break down.

Today
We have run too fast too soon, all indicators are heavily overbought however this did not prevent hte market from rallying on Friday. We have broken the 918 range now which should represent a bit of support now on the way down. I would expect a small retracement now that many traders have returned.

How to trade this?
Well this is going to be a bit more difficult, one would say the short is the best bet here but I would be cautious. We are heavily overbought so I would expect a pull back however waiting for confirmation is the best option. If we break down below 910 we should reattempt the 885 range, on the other hand we have a chance to continue on the upside from here and remain in a more sideways condition.

Considering its the "first" day back at the markets for many I would wait it out today to see what is going to happen and what traders will do with the extra 100 points they got.