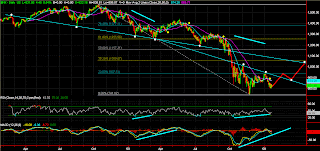
Well guys, I promised to be more objective yet again so here we go. I have spent some time looking at what we have gone through in the past few months and made an interesting observation. At first it seemed we were creating a descending triangle however after the strong support at 800 I went back to the drawing board to determine why this may be occuring.
As you can see we have a typical long term falling wedge reversal pattern forming. We have some slight violations, one on the RSI level with the breakdown below 850 however our MACD, volume (not shown), price peaks and lows are giving us signs of a strong reversal. As you can see from the trendlines I have drawn we are at the edge of a breakout point to the upside. I also added a second trendline that ignores the christmas action as this was quickly reversed and occured on very low volume - it was meant as a reference only but it aligns perfectly with our lower highs.
The market cannot sustain this wide range sideways pattern for long so I am looking for a decision yet again. I had mentioned that the 800 should provide a short term bottom and it has done so much stronger than I anticipated. The breakout can be confirmed using 2 possible scenarios. Either 2 very strong up days on big volume or the second more likly scenario is a strong day towards 857, followed by a distribution day possibly retesting the previous resistance range (840) and then a third followthrough day breaking the previous 857.
The market cannot sustain this wide range sideways pattern for long so I am looking for a decision yet again. I had mentioned that the 800 should provide a short term bottom and it has done so much stronger than I anticipated. The breakout can be confirmed using 2 possible scenarios. Either 2 very strong up days on big volume or the second more likly scenario is a strong day towards 857, followed by a distribution day possibly retesting the previous resistance range (840) and then a third followthrough day breaking the previous 857.
So it seems that after the bull has been beaten out of me it suddenly reappeared. I had updated my long term outlook this week and this still holds true if we are to break the 800 by next week - so do not count this out - one thing we can definitly take out of this, by Friday next week we shall be at least 60 points away from our Fridays close price.
Additionally our 50 and 20 dma are at exactly the same points now giving us another confirmation of a decision at our door step. The last week of december and first of January represents the first time since June 2008 that we have spent more then 3 days above the 50 day moving average - now this was occuring on very low volume so its not enough of a confirmation however something to be considered.
Additionally our 50 and 20 dma are at exactly the same points now giving us another confirmation of a decision at our door step. The last week of december and first of January represents the first time since June 2008 that we have spent more then 3 days above the 50 day moving average - now this was occuring on very low volume so its not enough of a confirmation however something to be considered.
Here is a longer term graph. I drew an interesting trendline marked with white dots - this would play in greatly with the upside reversal. The yellow dots are 20 and 50 day crosses whereas the last 2 support further drops in the market place. The redline indicates a potential setup for this uptrend with a top in the 1000 range.
Also take a look at RSI/MACD. We are trending down on the S&P while we are trending up on both indicators.

No comments:
Post a Comment