Tuesday, December 29, 2009

Just a quick comment

Hope everyone is enjoying the time off. Looks like we are in the process of getting our end of year melt up here. Whenever I look at low volume pushs to new high I am getting very concerned with more upside. I remember last year I was trying to short a bit too early and ended up having to carry quite a draw down but the end of jan showed big gains on the short side.

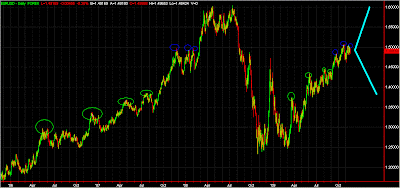
Not sure if this goes into the "I learned my lesson" type of category but I am looking to enter shorts very soon, not today, but most likely in the first week of january. For now I am 100% cash with the exception of my USDJPY trade - unfortunately USDJPY looks corrective here so I am thinking we may push on to break through this resistance cluster or at least test the upper most ranges (which also means I am getting stopped out).

Other then that, I ask you to look at the monthly charts for AAPL and GOOG. Wow is all I can say - I think once you see what develops there you will concur that some pull back is very likely - considering that those 2 are the bull pushers I would expect the market to follow.

At this point a correction will be good for both bears and bulls, we shake out some weak hands, figure out how strong support is on volume and have a chance to see what 2010 will hold for us.

Statistically we are at bullish extremes, more so then ever before, I would dare to say those extremes are stronger then the bearish levels we had seen back in march which ultimately resulted in this amazing move higher. The month of January at least will give us more signs of what the year has in store for us.

Till then, enjoy your time away and have a good jump into the new year.

Wednesday, December 23, 2009

Happy Holidays Again

I am out - probably will not hear from me till end of the year. Have a great holiday and enjoy the time off.

Farewell 2009

More FX obessions


Again talking about USDJPY. Sorry that I have been focusing a lot more on FX at the moment. It will change once the new year comes. FYI I have not made a single SPX based trade for the past 2+ weeks and been only focusing on FX (EDIT: with the exception of course on taking equity positions but only certain picks).

Ok I have marked a serious area of resistance and support with the blue rectangle. As you can see this has been a point of battle over the past year either trading above or below.

Currently MACD divergence on the daily is quite high so even if this does not move lower we need to continue sideways to get rid of the overbought conditions. The channel is the one I had been describing in the past and we are lining up nicely with the big support/resistance zone and previous down channel. So thus far it makes it 3 indications that we have some serious resistance ahead.

The last and final observation is the fact that every advance of the declining lower trend line ended up with a parabolic or overthrow like ending move - its even more visible on the 60 min. This again happened here with the last 3 days having been quite strong.

At this point my stop is close above the peak high now with minimal capital being risked ($200) and possible gains of a move towards a minimum of 88-89 ($3300 gains at 89). If the bottom is in on this currency pair its ok, we break important resistance rally some, and eventually will come back where we can go long. Either way a good setup.

As you can see risk/reward wise FX offers amazing setups and since you have so many different markets it pays of being patient and waiting for setups to come to you (instead of me chasing SPX).

Tuesday, December 22, 2009

USDJPY - Attempts


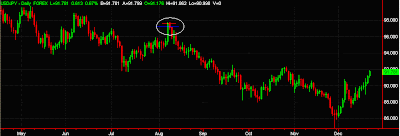
As mentioned I am looking at this one very carefully to be able to build a longer term short position. This one is a bit tricky since the majority of my FX trades had been based on more shorter term positions. I had made quite a few attempts in the first few weeks of my FX world a few months ago but not successfully.

At this point I am trying it again, a bit different though. This one is actually a very nice setup. I tried short yesterday towards the close as the 60min had a barrier it could not get passed, stop was rather tight on this one as we still had a bit more risk at another jump higher (thanks USD).

We are seeing the same pattern again today, first spike to mark the high and a few unsuccessful attempts to break through. Its nice since it allows you to build a position at the edge of the range with a tight stop. This time around the position is split with a tight stop again above the range and one thats a bit further away (while I sleep things happen you know).

Just for reference, here is my last long term attempt on this one ...

Got a nice short close to the top (blue line) and stopped out right at the top (red line). Not going to let this happen again this time around.

Again, I will be making quite a large "2010 start" post with a lot of focus on FX. One can say this has been my new "playground" with very little capital exposed and surprisingly quite a nice amount of gains.

USDJPY


Something to consider. I am going to watch this one closely for a reversal.

Friday, December 18, 2009

EURUSD


Just a chart =) Long this one at the moment. I may hold on to this one for a while and do not treat it like a short term FX trade (got in at the low of the day)

Just a quick thought

I was reviewing LOTs of charts last night and I have to admit, we have quite a few stocks stuck at resistance but what really surprised me is that the majority of stocks that have broken down are either at key support or have formed a bullish descending wedge over the last 2+ weeks.

The dollar is strong but its also stuck at resistance (with EURUSD trying to build a base). So what that means to be honest is that we either start a BIG correction with key support failing on many stocks (and therefore negating the bullish lower wedge on many) and stocks stuck at resistance failing to break through

OR

the more likely scenario to be honest is a breakout above resistance, rally from support and dollar yet again dropping with EURUSD going higher.

In terms of odds, I have to admit, being carefully bullish still seems the way to play this especially when looking at seasonality. On the bearish side, we can find just as many justifications for the market to stop here, break support to get to next support level and fail at resistance - however the only thing that is the wild card in this entire thing is the dollar. Weaker dollar will yet again give an excuse to continue risk through the carry trade.

I am still on the fence and quite honestly, do not know where this may turn we have strong signs for either side here, and it truly is one of those times where the market is at a brink of setting up for a larger 2-3 week move here.

Thursday, December 17, 2009

In Holiday mode

Well, there is not much to say about the markets at this point, still the same old range without any clue for direction. (I just took a quick long at 1096 ES FYI).


As you guys know I have been very active trading FX using EURUSD and I have to admit I am a bit ashamed I have not been able to profit from this move lower here. What a move this has been, 3.5 months worth of gains wiped out within a matter of 1.5 weeks. staggering to be honest.

I wanted to address a question that was brought up last week in regards to FX. When it comes to FX, those markets behave very different from standard equity markets - yes they all follow technical patterns just like any market but the moves can be much more drastic and swift - due to the high leverage in FX (even if you trade small sized lots) one HAS to respect stops - as you can clearly see form the above chart - once a currency has setup for a strong move or breakout there is no stopping it. On the above chart its especially visible - there is no chance to get in on the short side unless you have a much wider stop which is quite difficult to manage.

For me personally, being new to FX, on the above chart it has been VERY difficult to get a short position as I am used to tighter stops and EURUSD has given traders like me no chance to get in and profit from the down move. Its a matter of style and my style does not fit well with the above chart.

Now whats very interesting is the weakness in EURUSD and no effect on the market - if and when the dollar makes a turn and retraces or resumes the primary trend (if that is still the trend) we can expect equity markets to move higher. Seeing such a large decoupling is a bit worrying and can be a preset to a much larger correction in equities - however due to seasonality its quite difficult to commit too a larger short exposure during this month - at least for me it is.

As I will be getting ready for XMAS I may not be around much for the rest of the year so if I do not see you before ....

Happy Holidays for everyone

Monday, December 14, 2009

No Comment

Yeap no comment - there really is not much more to say as we are still range bound. The edge goes to the bulls at the moment as we had 3 attempts on the lower side and 3 on the upper side now being the 4th attempt to go higher. Based on charts - probability on breakout higher is the highest.

Its opex week as well in the lightly traded month of december. At this point I am staying out of the markets probably even for shorter term scalps until the new year. Lets get 2009 over with so we can start fresh for 2010 =)

Thursday, December 10, 2009

I promise


For some reason the combination of both of those pictures ... it just makes me cry a little. I mean what a market. Just sit back and take a look at this daily chart of SPX. Incredible.

Wednesday, December 9, 2009

Consolidation to go higher?


In order to remain flexible for short term trades one has to look at both bull and bear side. At this point I am in slight favor of a bit more downside however we have a good risk/reward ratio for being carefully bullish at this price range.

I outlined the chop zone range breakout confirmations in the long blue rectangle. As long as we remain in this range we cannot be sure of direction. We can even go all the way down to the close on Nov 9th and still be considered in the chop zone.

Now here is whats interesting. After entering the zone of naked option holder death we had seen a repeated pattern.

3 days on the upside, 2 days on the downside. Now on our 3rd attempt we remained in the upper range for 5 days and attempted to break out. We failed to make that happen through an overnight GAP above resistance and reversed lower but did not sell off right away. We are now back on the lower end and its closing on the second day.

So the question we have to ask ourselves.

1) was this a failed breakout and we are done? (done short term wise)
2) or, we did not have enough distribution at the top of the range and needed to come lower one last time to be able to break the overhead resistance.

Both are still very valid and even if we break lower here towards the 1070 range, this still has enough power to push through the upper ranges as we will be quite oversold once we reach 1070.

No decision yet ... but as mentioned I am 51% on 107X first. If we do breakout higher tomorrow then I think we can be confident of higher prices and a break of 1120. But let the market the market show us where it wants to go.

Tuesday, December 8, 2009

A quote from a fellow blogger

If you follow mole over at evilspeculator (not just because he is german too). One of the readers just posted an interesting comment.

"Tops tend to be processes while bottoms tend to be events."

Comment made by "bubble jeopardy".

Great stuff !!!

Anyone still here?

Balanced Gap-less cash only hours

Sometimes I like to play around with the GAPs a little bit to focus on what I consider "balanced cash only hours" - meaning for every GAP higher, balance out the chart with the GAP lower. Looking at our GAP and chop zone above 108 SPY we had 3 gaps higher and 3 gaps lower. I am only using the significant gaps here not every day. If you were to reverse those based on the number of gaps in this zone you get the following chart.


So even with the GAPs removed this is one ugly looking chart but also a great indication of whats going on in terms of buyers and sellers. So lets take a stab at it.

1) there do not seem to be any new buyers
2) there are no sellers either

So what is it then Chris? if you know the answer please let me know because I have no idea how this will resolve. Anyone who is trying to make a call here - be my guest and assist us in trying to figure out how this may resolve.

The point I am trying to make - we HAVE to wait for a breakout before committing to any side here.

Refusal to commit to a trade

Well, what a day, we had a nice gap down but after the GAP occurred the market yet again remained in a narrow range. As you can see I have been focusing a lot more on FX and even there I keep it small - in a way I am trading SPX through EURUSD.

So first point on FX - as you know I have been trading EURUSD quite a bit in the past 2 months with with my main focus on being positioned short, though I did not shy away from any long chances. However after we had tested the 1.51 range I have been looking for a good short position and I am a bit ashamed to admit that I missed the boat on this big move we have seen here. I had been too focused on the strong support at 1.48 that I really was not ready for a move lower. The EURUSD appears to be completing a proper 5 wave structure and I am kicking myself a bit for having missed this great move lower here - however, did not loose money overall so I am not too upset.


Keep in mind FX markets generally have a much larger 5th wave so we have to be ready for more downside, unfortunately downside that is not tradeable - so it will take a few days before we can find a great entry again on this - whether its long or short. We are currently at important daily support here so we have to see how this plays out.

Now SPX wise - what can I say, the only way to get a proper reward for a position is during overnight moves and I refuse to gamble here on SPX.


We are still in the chop zone here and today appeared to be a nice attempt to move out of this zone that again lacked the follow through from any bulls willing to take profits or a bear moving in. Yes I can see bears getting excited but look at this above, there is nothing to get excited about, there is no follow through and no real direction. Take a look at the previous declines, we had some proper follow through and all you see here is total whipsaw for both bulls and bears. As long as we remain in this range it will be very difficult to get a proper position that I dare hold longer then a few hours. Even a breakout on the upper ranges has to be approached with care as this rally is looking rather weak here to be quite honest and after 9 month of upside - who wants to be the last one on the ship?

Seasonality wise - its December and everyone expects December to remain neutral or bullish - again the contrarian would say thats exactly what they want you to believe - you all know what I think about the concept of market trying to inflict the most pain to most players - simply do not believe in it.

So what to do from here? I still feel the best position to maintain is small in size, with tight stops and minimal risk exposure. Why gamble for a 10-15 point move when during a normal trend 15 points are just a small fraction of what is tradable.

Micro = Macro


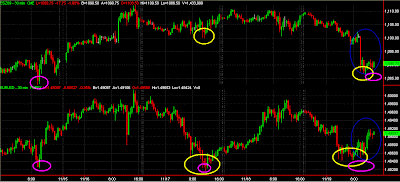
The funniest thing just happened to me while watching the 1-min EURUSD chart on my current long position. I almost crapped myself when looking at this chart. Look at the similaries of this 1min chart compared to SPX 2 year daily chart. Its looking like we are up to July now on the last peak of EURUSD. I know its not the same, dont get me wrong but the similarities are amazing. Lets see how this one plays out in the next 60 minutes and we should know where SPX will head till march? quite funny.

FYI - the 9:00AM zone looks just like that 880 failure to go higher back in July - the one that cost me a LOT of money. Maybe its those horrors from back then that play with my mind ....


Open at key trendline

If we remain at current levels we will open at a key trendline. Now we are down 1% which should give us a stepping day again, however, in the past down gaps at least have been filled partially while up gaps run away.

I am not sure what to make of the price action quite yet. We have seen big moves in the dollar but SPX is not following - it does not mean dollar and SPX always have to work together but considering that we have seen great strength on the dollar we are actually up on the market all things considering. EURUSD is yet again at a key trendline as well with decent support but we did break the 1.48 range so this may qualify as a real break.

If we do not see higher prices within the first 15 minutes we can be sure that we will see the 1084 range possibly today. For me to engage in any longer term bigger trades we need to see a break of this range and a retest on a separate day. So for today, I am actually looking for a long position in the morning hours (long EURUSD at the moment) and potentially a short on retest of 1110 ES.

Lets wait it out and see how it develops. Remember my charts from yesterday, we do have a bit of support on the lower side but in my opinion its quite weak as the price action above this support is not what I would consider "stable".

Monday, December 7, 2009

Nothing much changed


Well we are still in the same old range and nothing much has changed so it seems. In my post this morning I was talking about the market burning off overbought conditions. I wanted to show you one of my daily desktops that I check at the end of the day. I mean really ... how much more screwed up can an index look? I am used to seeing those type of almost irrational moves on individual stocks but never on a broad index.

Left side = dow daily, you can see we have good support anywhere from 10200-10300 but the price action above this range is so weak - well it will take a splice through that support and its done. Looking at the MACD though, it did make a higher high so thats rather bullish on the DOW. We also switched back into negative divergence on the MACD (same on the others) while being a mere 10 points away from the 12+ month high - incredible.

Now the center one, SPX, no new high on MACD, and that bolling keeps squeezing every day that goes by. I think this must be the narrowest range I have ever seen on a bollinger on an index. 1116-1085 - another incredible one.

Now last, spy on the right hand side. Mini wedge in the big march 09 wedge. Would not be surprised to see a breakout of the small wedge to retest the march 09 wedge around the 1140-1150. Interesting to note on the spy chart is the volume - again dropping volume and big volume spikes once we approach the edge of our ranges - either on the top or bottom.

Enough for tonight. Not much going on - quite upset at being stopped out on my GBPJPY short from Friday - stopped out right at the top. I have to admit - this one seems to happen quite frequent on FX trading ... (though I did nail my EURUSD long from friday to sunday night at respective low and high so I guess its a wash).

End of Year

Well, what a week we had last week. Nothing much has changed from a big picture perspective but we did see a significant move on EURUSD (the dollar).


As you can see we are still within the trendlines we have been using for the past few weeks and have broken important support. Not only did we break the 50dma (first close below trendline on friday) but we also gave up the important 1.48 and are slowly creeping back above it. We made a lower low today BUT MACD divergence (not shown) on the 60min is pointing to recovery higher (meaning weaker dollar).

Now equities wise, looking at the weekly chart we have continued to consistently make higher highs and everything appears to be bullish.


I had made a post on Friday about this topic and was quite active also on other blogs indicating that while this appears to be the best case for a pullback for the bears - we should not ignore the big picture. If this were any other months during the year I would be quite bearish in terms of positions I am looking for, but I have to admit its quite uncertain. On the daily we know it does not look that bullish after all - but consider this, the last time we were at important FIB level (38%) it took 3 weeks to break through, we are now at the 50% levels and have been operating in the same range for 4 weeks with the market making marginal new highs on a weekly basis.

This sideways action we have seen for the entire month of november and into december could be the consolidation needed to go higher. Take a look at when we first breached 1100, our indicators were quite overbought on the daily charts, looking at today, we have turned into a neutral zone even while making new highs and not selling off.

Please do not misunderstand my comments as bullish, its rather meant as a way to describe that one should remain neutral or "carefully bearish" until the market resolves itself.

Personally I believe when looking at charts we have 2 possibilities going into Jan-march time frame - a run towards 1200 SPX or the start of a larger pull back that should bring us into the 930 range by March 2010. I will post up more longer term charts this week to show the potential moves.

Currently we are still range bound between 1084 and now 1120. A very tight range and a breakout to either side should give a move of at least 20-30 SPX points.

Other then that - nothing much to say, its december and I would advise to stay in scalp and very short term mode unless you are invested outside of this range (short at the current top) or long at or below the 1084.

Friday, December 4, 2009

Blogsphere Emotions

I wanted to share some general thoughts on whats going on in the blogsphere. It seems everyone is ready to accept that we topped, the majority of comments I see are about longer term positioning for puts and shorts, and that we are finally turning lower.

As much as I agree from a fundamental perspective (well you all know me, I am as bearish as they come, even during a 10 year bull market). However lets review some facts:

1. We made a new 12+ month high today
2. We are still up on the day
3. We are within 1% of the most recent high swing

All of those facts still point to an intact uptrend - even if we move lower towards 1016, this is still a fully valid uptrend as much as I hate to admit it. I am very surprised to see bearish traders come out stating we are going down and this is it. Maybe this is the pre-stage to the last bear slaughter we will see this year and a xmas 2008 like rally to end the year or this is really the move lower.

After I had changed back to my short term system, my head has become a lot clearer and I am looking for pattners based on price and not based on opinion (well a little bit heh). We have many bearish divergences and the past 18 trade days on SPX look like from some very thinly traded penny stock. I mean seriously look at those daily candle sticks on SPY. Incredible. Not very bullish at all.

Now, me personally, I was ready to be 100% short at 1016 when we had tested it the first time with a target of 880. We are now 100 points higher, amazing, but the same still applies, I am ready to be 100% short at 1016 - AFTER we retest it from breaking into triple digit SPX - think about it. Yes I would love to be short from here to get all the way to 880 from 1110+ but come on - we all know we never get 95% of a move in position. The point I am trying to make, I see in many other traders now how stubborn I was before, wait until the trend really changes, then get in and position yourself. Its probably the biggest lesson I learned this year at my first attempt at IT trading (remember I used to be short term only).

Lets see how this plays out.

Thursday, December 3, 2009

Monthly Recap: November 2009

Well, I am still a bit down with the flue but I wanted to put out an update for the month of November. As mentioned it was an up month yay. Positions from nov 5th till today gave a total of around $2K in gains - I made another $2700 with 2 other trades in the first week that I posted in comments but that was before the "new beginning post" - I am still going count it though.

Now, while it was an up month, I have to admit it was a lucky one that I came out on top as I pulled myself into the greens within a matter of 2 days thanks to our dubai craze. On a total capital of $60K (though never invested more then 30%) thats not quite as good of a return as I was expecting but acceptable.

As you can see the only "real" losers were my longer term position attempts - one would say I learned my lesson before but it seems thats not the case - over $4000 in losses from longer term puts, overexposure and not sticking to my short term trade system - mainly dec spy puts (longer term attempt), AMZN & POT short (overexposure).

If those would have been smaller losers (like they should have been) the month would have been quite a bit better, could have should have would have I know but it just goes to show that not sticking to your system can be devastating.

I do not expect to be doing much trading during this month with holidays and everything else so I am not going to be such a self critic here in December.

One small change on accounts, I am merging the capital for equities and options into one since its a bit easier to keep track of it.

Soemthing not right in the mothership


As much as I "enjoy" watching this sell off (though not participating) I am skeptical as always. Where is the dollar? I know we had said that we see more and more decoupling of both of those markets but would really like to see some follow through on the dollar as well with this move.

A real retail Trader


I had a great day today trade wise. Locked in some nice profits and got into 2 positions I would like to hold on to a bit longer. However, this lesson again goes to ALWAYS use stops no matter what it is you are trying to do.

I had entered SRS at the double bottom, as I had not traded SRS in a long time I realized that with such a low price, the moves are not always favorable for proper stop and scaling mechanisms as the bid/ask spread on such a low price etf will cost you quite a bit.

So I rolled into IYR as a short instead (smaller position and of course less leverage) but I also closed out SRS by hand. So lesson here - EVEN if you roll your capital into another position, do so by properly using sensible stops. As you can see straight line up after I had closed out by hand. Yes I am in IYR as well but it just goes to show that stops should ALWAYS be used ... again ALWAYS.

Another chart of interest


Take a look at this peak advance ratio. We are decreasing our angle on every consecutive peak we are making on SPX. Even more interesting that we had been consolidating in a very narrow range for almost an entire month now and every attempt to move the market higher is being faced with selling pressures - but not enough selling pressures to move the market lower.

We are coiling and continue to stay very narrow in our daily ranges, the challenge now is finding new buyers that will commit to the markets at those price levels, buyers that need to have a very long term focus.

We have 2 ranges ES wise. 1115 now as our peak (a break here and we have a move into the 113X range) or the 1082. IF we are to get back to 1082 I think we will see a break lower and finally some real profit taking (not just protective put buying on open positions).

EDIT: one would consider that after such an extensive coiling pattern the following breakout will be very strong - however, a breakout on the upside will face the same challenges its facing now, while a breakdown lower will actually work "easier". its also possible as always that the first move out of the coil could be the false move to reverse back even stronger. its a difficult call for sure - one that no one seems to know the answer for. I'd give it 51 down and 49 up (which is quite incredible that I am assuming a 49% chance to move higher from here)

But looking at the above chart - not looking all that bullish - in addition to that SPX is racing against the march trendlines and eventually the market is going to have to give this trend line up. This can be done through side ways price action as we may be seeing here or through larger retracements.

Holiday and being sick

Well last week I was quite busy with family in town and starting this week with a summer flue and having to catch up with work is quite a battle. (yes a summer flue in Miami sigh).


I wanted to show you this EURUSD 60 min chart that is begging for another breakout. Lets review it first. We created what seemed to be a bullish lowering wedge or a descending triangle first (blue circle) - we broke out on the upside as we had anticipated and had 2 nice retests of that falling trendline (green circles). Now we seem to be building and ascending triangle that is begging for yet again another breakout to the top which would indicate higher prices yet again. I am ignoring the dubai craze on this ascending triangle (second green circle) since it recovered before cash hours were reached in the US markets.

Looking at this we have good support at 1.504 from the previous top and the ascending trendline of the triangle. If this were to resolve to the upside (which has a high probability) we could be seeing another 30 pts on SPX and possible break of 1.52 on EURUSD (though I do not believe we will break that range on EURUSD)

Wednesday, December 2, 2009

Failed breakout?

If we do break 110.73 on SPY its very possible that we just saw a failed breakout.

Tuesday, December 1, 2009

MIA

Sorry for being MIA - some more personal issues to resolve. Will make a post shortly =)

Friday, November 27, 2009

Quick update

Well as it was my birthday yesterday I went out last night (right after I had closed most of my positions). Quite incredible moves even last night (yes I was glued to my iphone - quite sad).

Positions
Overall quite lucky for me to have profited from this move I have to admit. Technically it was a good trade at the top range for a 3rd test but never would I have expected such a move.

EURUSD held right at the previous trendline it broke out of, though it reversed all of the breakout and then some so expect any support to be short term. I had closed out all my EURUSD short yesterday with some amazing gains - will have to monitor this very closely as I really want to get back into a dollar bull position.

ES futures was closed out (just 1 contract). Gold short contract is still there and up nicely as well, this one will be kept a bit longer here. My puts will be 100% breakeven around 106.50-107 if I keep it as is including the hedge. Since this was quite a bad trade on my part I am looking to walk away from this soon so expect me to take profits (and losses) on those puts as well.

What to do next?
Well - I have to admit, I will probably just watch today. We only have a shortened session today and a lot can happen - a lot in either direction. We have a potential for quite a bit of madness today with BIG swings (20+ points in either direction).

Today will be an important test for the market in terms of liquidity. Is there any left or has this really been a HFT based market that will go nuts when real money comes in to get out.

Thursday, November 26, 2009

Currency Market Madness

I hope everyone is having a good time and enjoying their turkeys. After such an extreme session I had to give it some more attention here tonight and boy. Never seen currency markets with such huge swings across the board - not just a single pair but many different currencies. We are seeing moves of 1+% within a matter of 15 minutes - keep in mind that we are talking about a LOT of value being moved here and intervention in those markets are much more difficult then pushing the buy button to provide some liquidity into some equities selling.

It is really difficult to see how this will play out here. Again - moves of this magnitude are very rare and need to be monitored very carefully - the problem with currencies is that the leverage can be so large that big moves such as this one here will cause quite a bit of craziness. We should calm down here by tomorrow morning but I do expect tomorrow to be very interesting once our short day is open. Keep in mind we only have a bit more then 3 hours so ....

Happy Thanksgiving for everyone

Just woke up and wow

Speechless yet again. What an overnight session here lol

Wednesday, November 25, 2009

EURUSD Breakout


Yes we had anticipated this on Friday and it did a perfect breakout above the trendline, retest of the trendline and a STRONG move higher. It seems we are seeing ourselves in a w3 that may complete today which should follow with some sideways action above the previous high (though I expect we break to go a bit lower) and then possibly resolve this around the 1.52 range that many had been calling for.

There was an interesting topic on evil speculator about this as well. One of the arguments presented is that the carry trade is almost over. It now takes a lot more for a drop in the USD currency to move up the markets and the tight co-relation is distancing itself more and more. Looking at the parabolic move in gold and xtrends (sol) calling a top in gold here as well is even more of a sign that whatever correlations the market had are starting to break up.

Take a look at financials (XLF), real estate (IYR) - remember those are the ones that got us into this mess - and where are they today? far away from previous highs without any sign of retesting them in the future.

Based on the disconnect in many sectors and the crazed parabolic moves, breakouts and other we are nearing an important turning point - either melt up higher and go into a parabolic equities move or start of larger retracement that may turn into something more. At this point we have too many important lagging sectors that need to be rotated into or brought back higher to give this up trend more confidence.

Its still a holiday week and I am forcing myself not to take any trades - I am still in wait and see mode as we continue to be range bound and burn off time. If we do make a break for 1120 this week of course expect me to leg into more shorts.

Holiday Spirit

Well the holiday's are preventing me from doing much market related stuff ... but boy oh boy look at EURUSD. Nice breakout there indicating a new high just around the corner for SPX.

Tuesday, November 24, 2009

Not what I expected

I am on a semi-holiday week ... however wanted to comment on price action this morning. Not what I expected especially after the overnight session and the EURUSD strength.

Not sure what to make of it quite yet - give it until 11:00 and I will make a post with direction.

Monday, November 23, 2009

Looks like we know where it will turn

Unless this gap will be reversed within the first 30 minutes of cash hours we can assume it will stick for more then a few days. We had been waiting for the market to make a decision and it seems EURUSD has broken out of the triangle and is ready to march for new highs. Same with SPX as current futures indicate a 1% GAP - we all know that up GAPs like to give us stepping days with low of the day being set within a few points in the first 15 minutes.

Looking at ES we still have some resistance levels to overcome at the 1102 (where we are currently and we may see a GAP above this resistance) and of course 1109-1112 levels. However, it will be quite difficult to overcome those levels as EURUSD will not have much more room on the upside for the day.

On the lower end of course 2 important price levels at the 1094-1095 and the 1090-1091. If we are to see a break here on the downside (which is very unlikly for today) we are back to 1084 which again will provide support. Quite difficult today.

The other thing I wanted to mention is breakouts when looking at equity markets and when looking at FX. We have seen many fakeouts on the SPX in the past, for both bears and bulls alike, however a breakout on FX has a much higher probability of sticking so the action we have seen with EURUSD during this overnight session makes me a believer of higher prices to come this week. Top this off with turkey week and we have lighter volume and statistically bullish price patterns in a holiday week.

For today - it will be wise to not enter any new trades. If the GAP will stick we should not have much more upside, at most 10 points so taking a long even for a scalp will be difficult to justify into short term overbought conditions. Taking a short at the same time carries the same amount of risk as retracements should be limited to the open price at best. Of course if we do not end up resolving into a stepping day its anyones game but even then we may get some strong upside moves.

Friday, November 20, 2009

Online Portfolio tracking

I have to admit keeping track of my trades via HTML is quite cumbersome. You guys know any web based portfolio trackers (one that also works with futures and options) so I can list my trades there instead? It should be able to be linked somehow so I can link it on the blog itself.

Any feedback would be greatly appreciated.

One last one before I leave


I am sure you are all familiar with island patterns. Now looking at spy and adjusting price based on the island reversal look what its forming here? Yes a very long 4th wave, bull flag, lower bullish wedge. Whatever you want to call it. If you forget about what happened before this chart (emm yeah the 9 month crazy rally that many are saying is coming to an end) then all I see here is a corrective move that should be finishing up shortly to come to new highs.

Remember what I said yesterday - too many charts, too much over analyzing will play tricks with your mind.

Which one is it?


Bullish lowering wedge or descending triangle. Keep in mind this descending triangle also has the 50dma ... a break through that 50dma ... and boy we are off moving.

No update today

Sorry - work again. Only thing I can say - another 10 point gap lower wow. 1082 is key today.

Thursday, November 19, 2009

Too many charts

Whenever you see me post too many charts you know I am unsure of the markets and try to look for any reason or pattern to attempt to make sense of direction. One of my main reasons yesterday for minimizing short exposure was just because of that. We have some very compelling bearish patterns developing but at the same time the bullish (whether manipulated or not) side is quite compelling - not for a trade, but for a reason to stay out and remain short term focused.

Either way - blog emotions are running high everywhere, bears capitulating, a million different calls for directions, sentiment change left and right. We are at extremes yet again, though one can argue we have been at extremes since our amazing July rally (the vicious head and shoulders failure).

As I am typing this I see SPY drop 2 spx points on the 1 minute chart on not even a million shares traded in that one minute. Talking about liquidity issues? Just imagine what would happen if the dollar goes nuts here as well. If the dollar is able to break the support I had shown in the other charts - then we really see if there is any real liquidity left in the market or if the last 2-3 months up have been a result of dollar and continuous exposure to more leverage by bulls.

And another one for mental masturbation


This is a bit silly here but some comparisons can be drawn. This one will definitely be filed in the "emm Chris, I think you are over analyzing" category.

Another one for the dollar


Well it seems EVERY blog is now talking about the dollar. Do you remember 3 months back when we were the first to bring this up as a big carry trade. Kind of proud of the fact that we have been talking about the dollar here for many months already during our charting. Now here is an interesting chart of ES futures and EURUSD. I highlighted some areas of importance.

This market is not going anywhere until the dollar makes a turn here ... when looking at the EURUSD daily - check out the 50dma.


Now 2 things can happen here - against all odds the dollar has been at this exact same spot before - take a look at the EURUSD 3 year history can you can see that it can actually do the total opposite and just launch higher like a mad man causing us to have a huge meltup on the markets. Now the obvious thing here is down - and considering how many dollar bears you have, you will see quite a short covering which will make this bad boy plummet.

So important turning point that can go both ways. Take a look at the daily ranges and tight consolidation in the last 2 weeks - this is coiling up for a BIG move. One we need to participate on - up or down - do not care =)


Will post updates mid day

Sorry again work is taking over. But take a look at the post from yesterday in regards to the many scenarios we have for this to play out. I for one am still unsure if we make a move higher first or retrace.

What do you guys think?

Wednesday, November 18, 2009

Another chart of interest


Take a close look at the 61% and the 161%. This is from our previous low spanning accross our 3 peaks. According to this one we have a top building before the day is over.

No Idea


There are too many possible scenarios at this point. As mentioned this morning did we have a failed W5 (yellow) or is this a more complex W3-W4 (blue). Both are valid technically though the more complex W3-4 has a bit higher probability due to the sideways action after we had reached the top.

As you can see there are many different variations with neither one of them having more of an edge - with the exception of the major trend winning - up. So if you take a look at it from the trend perspective up is the only way to go.

One could still say we have a descending triangle from the top on monday which means another possible run up towards 1009 that should fail there. Overall ranges have been extremely narrow since the Monday GAP and we have yet to try to fill that GAP. Markets down while EURUSD is up - another big divergence to notice - of course yesterday an all up day which is quite rare and was a sign of more correction to come.

Position update
Don't you hate when some cries about having entered the at the wrong time and price. You are not coming here to hear my complain and bitch but to find information about markets - but then again I need a place to talk out loud - this is one of those times so ignore this section =)

Well my EURUSD trade yesterday - kicking myself quite a bit. I did not expect a big rally there but boy was I wrong. That would have been a nice move and a great hedge for my positions. My out of the money 106 puts are burning a whole into my account every minute that goes by. I expected to have to carry them out of the money for a bit but they have been out of the money since I entered the position so thats not good either. So at this point I have few options really.

1) close the puts and take the loss - seems the most sensible if I am unsure and as you can see I am.
2) roll those into in the money puts - probably the smarter move here.
3) wait until Tuesday next week as this is opex week and one should not make large adjustments to positions during this MM crazyness
4) hedge by entering a spread - may do this on a break of 1110. Thats one of the main reason I closed some today to free up some capital as I am limited to 15K on options, with a big percentage already as a loss.

Still deciding on where to go

Well the market continues to make it clear - any pull back will be bought and the market seems to only have one goal in mind. Go higher. We had been talking about various resistance levels that provided a short term barrier but ultimately small pull backs of at most 60 SPX points was enough to distribute and take on that same resistance again to break through.

While we had some lagging sectors during the last up run with DOW being the leader, many have caught up. I went through probably 100 different charts yesterday, and I have to admit, while many seem to be touching their respective 52 week highs, I see no strong indication for a pull back to come. Of course there are some great charts of weak players that have broken down but its a smaller percentage of charts showing this type of break down.

Looking back at the charts from last week we should still be in wave 5 and may have completed it as a failed W5 attempt, however, based on price action we could still be within a complex W4. If that is the case we have to be ready to accept 1130 at the minimum.

As mentioned, charts at this point post a 50/50 type of setup. As we are entering a historically bullish month of December many are pointing to breakouts on the upside, while a few are more bearish in nature. I saw an interesting post on slope of hope yesterday. It seems Tim has gone back to pure equities trading as this may provide an easier way to profit from the market. I tend to agree with that view point after seeing all those charts yesterday again. Lets see what the remainder of this opex week has in store for us before we make any more calls for longer term direction.

Tuesday, November 17, 2009

OK some time now

Well we are seeing a nice sideways day today - after having reached a new high some distribution is needed to go even higher. Based on what we can see today, bears are gone and we still have some buyers left. Daily range is pretty much the narrowest we have seen in a while and technically we should not breach the upside for more then we already have. Its 1:15 now and we have had a 7 point SPX range while they are burning off the puts a bit more.

Now lets look very carefully at the below chart.


MACD is on the edge of breaking out on the upside which will invalidate the bearish case. However we need to get 3 daily closes above this range to be 100% confident its not a fake breakout and this being OPEX - well who knows. Also take a close look at the MACD divergence. The only time it has been higher was during our July head/shoulder frenzy - so far it has exceeded our previous two peaks in terms of divergence so there is not a lot of room left on the upside. Being long at this point definitely has more risk.

IF we are do see a repeat here take a look at the sep run and oct run. In september it took a total of 15 days before market finally turned lower (counting from first green day), in October it took 14 days (or 16 if you could the last gap up day close to previous high).

Right now our count is 12 (or 11 depending on how you want to count it). That means we are nearing the possible end here. However if we are able to rally higher which at this point is pretty much assumed by most everyone we will take MACD with us and could have a potential to extend this pattern in a July like run up.

At the same time, the rare three drives topping pattern is the last hope for any bear out there. Bears could have a field day here with bearish patterns left and right, megaphone, bearish rising wedge, divergences left and right, EURUSD not able to make new highs. I could go on - yet it seems we keep on busting higher as more and more bearish divergences build up. Since we have not see any proper bearish resolution for any of those patterns even all of those could get invalidated after the fact.

Yes I think we can all agree that the more likely scenario is a move lower to finally even out those divergences and give another chance to the bulls in a few months time at lower ranges. BUT, as we have seen over the last few months - bears continue to get the shaft. I for one am really looking forward to see how this market will resolve itself towards year end and into the first quarter of 2010.

Quite busy with work today

Sorry guys no pre-market update. Will post in comments.

Monday, November 16, 2009

Important Day - closer to all time high then the bottom

Well, an interesting close today. Just forgot about the markets for a second and let this sink in. We are now closer to the all time high of the DOW - then we are to the bottom that seems oh so recent.

It took 17 months to get from the 2007 October highs to our 2009 march bottoms. And it took 9 months to get back half way. Its kind of amazing just looking at those numbers from a longer term perspective. Its been an astonishing rally thus far and its really something when you think of it in absolute terms - we are now further away from the bottom then we are to the top (yes I am saying it again).

Ok thats it for tonight - just wanted to share this thought =)

Watching the upper range again

Ok for today its quite simple. As always with our 1% GAP scenario we have a good chance of a stepping day. We had been testing the 1098-1100 range a few times now so a clear break is likely. The question remains what upper ranges will provide enough resistance. Of course first our old ranges at 1107-1110. If those fail anything as we had described in the past as the topping range from 1116-1132. It will be difficult to figure out where it will stop and we can only determine that on a proper reversal.

Now this week is OPEX - we all know opex provides quite crazy ranges and moves so we have to be prepared for fakeouts on both the bearish and bullish side. Looking at this market now, it really seems the sky is the limit and there is nothing holding it back anymore. We are about to enter December, historically a bullish month.

The bottom of the Globex session is 1091, which also happened to be fridays close and represents the bullish/bearish short term line, a close below we should see more pull backs, a close above and we are on for 1130 upper ranges.

Amazon has breached my 133 range and my puts are down around 50%, probably more at the open. Will have to figure out how to get myself out of this one =). I am not too concerned about the SPY puts as we can micromanage this position a bit easier. Its always difficult to trade one out of a bad position, so lets see if I can manage to minimize those losses on both puts this week before expiration.

I will most likely not place any new trades today as I want to see the market play out at our key ranges before make a decision.


Sunday, November 15, 2009

Futures going quite nuts again after only 2 hours

Well big move in futures right at the open. I wanted to restate from Friday:

"So today its important to watch the 1082-1085 range. A breach here will put higher probabilities on the failed W5 move, if we manage to stay above this range today and close above 1091-1092 we have to be ready for more upside. The upper side is 1096 that we need to monitor closely."

Quite ironic that we hit the low and high of day right on the head - within cents on the low and exact on the high. Now whats even worse is Fridays close ... well we closed at 1091.50 (yes right in the smack middle) - this again gives a 50/50 chance to either bear or bulls this week. It is quite ironic that we closed right there. I had mentioned on Friday I was looking for a short opportunity tonight but will hold back until probably 4:00-5:00AM tomorrow morning.

Have a good end of Sunday and look for my update post in the morning.

Friday, November 13, 2009

Key Levels to watch today

Its Friday the week before OPEX so we have to be ready for some wild swings next week. You all know me, I love swings especially on short term trading setups. I have been holding back the past few days on day trades as I wanted to see how the top would resolve itself. As mentioned in the post yesterday I am still a bit unsure of direction. You may remember one of my favorite quotes

"better being out of the markets wishing you were in, then in the markets wishing you were out"

This currently applies to my puts as I am quite concerned with another push up here. It is possible that we have set a possible short term bottom, one that actually qualifies as a valid W4 corrective move at 1085 ES. This was my main reason for my long attempt yesterday though I did not want to risk too much on this possible trade as I was still sure that we had made a failed W5 move. As it turns out we still have a high potential setup for higher ranges into OPEX.

So today its important to watch the 1082-1085 range. A breach here will put higher probabilities on the failed W5 move, if we manage to stay above this range today and close above 1091-1092 we have to be ready for more upside. The upper side is 1096 that we need to monitor closely. It is very possible that we stay within this tight range today but I would not count out a recovery to break above this range.

Below is my updated bullish count - which is currently my main concern. On the other hand remember we still have a possibility of the SPX high being a short term top at least. Take a look at the MACD again on the daily - yes - a HUGE divergence that bears should be happy about and bulls need to overcome. However a rally into the upper ranges as identified below should help bring MACD higher.

Thursday, November 12, 2009

Uneasy Feeling

Something odd happened to me to me today while watching my charts and trying to pick a trade.

For weeks now we have been talking about the DOW 10300 and a new marginal high on SPX - it finally happened. Though keep in mind I am not necessarily saying this was a great call - it seems any resistance number you name will eventually be reached, just like it did for 880 which seemed a great call back then, 930, [insert any other top calling attempt here] - currently we are at marginal new high of 110X - yeah way to go Chris =)

We had described our scenarios to look for yesterday, while I did expect slightly higher prices we were pretty close and it seemed at first we were right on the money. However, the move after having hit the new high for SPX yesterday does not sit very well with me at all. Yes we have light volume due to holiday but todays sell off has even less volume then our peak yesterday - a bit odd and suspicious.

So during the trade day today - if you followed me in the comments you can see I was a bit all over the place, not my normal type of style. So at this point - I think I have fallen for over analyzing this market a bit again - trying to make sense of the moves it makes, and trying to anticipate direction and yet again realizing that anything outside of a 10 point range is still extremely difficult for me to gauge. Maybe its just my german mentality, the need to be in control and having the ability to anticipate what will happen that has driven me a bit mad here today. My overall views are bearish - but today I started to question myself again - and I think rightfully so.


Take a look at how far EURUSD has come down while ES did not make much of a move. EURUSD found support just as we had anticipated but I was very surprised to see that the dollar did not take down the market more then it did. Keep in mind my entire basis for the market trending lower has been the dollar. We have been talking about the dollar for months now and for the past week I have been getting very suspicious of something going on - we seem to be loosing our relationship more and more. To be honest I am not sure what effect this could have - and whether or not this divergence will balance itself out again or give us first signs of things to change. We need to keep our eyes on this one very closely.

So overall - I see myself in no mans land again - not sure what to make of this and whether or not we had a failed W5 (as per the chart from earlier in the week) with an ABC correction?


Yellow indicating a completed 5 wave move, blue indicating a correction which will ultimately mean higher prices. The move off the highs does not look impulsive to me at all - meaning we should not expect much follow through. Next week being OPEX week will even add more madness to this. So I think its time again for me to stop trying to figure out the mid/long term direction. Just play it day by day - that has worked amazing in the past didn't it?

A bit hungover

Had a few too many drinks last night so no update. I had mentioned yesterday after the close that I think the market is not quite done yet. We found support at EURUSD and I am not counting out a retest of yesterdays high and a potential to hit our target of 1107-1110. Once we get there we can figure out if we are heading for the primary targets of 1116-1130 or see the 1080 levels first. We filled the GAP from yesterday during the intraday and also retested it again today making me think that we are not quite ready to head lower.

Wednesday, November 11, 2009

Will not have time to post update tonight

Wife's birthday today so no time ... but wanted to let you know that I do expect prices to move a bit higher still. Yes we did reach our DOW target but the marginal high on SPX especially with the price action today does not qualify as the end of the move.

We expected the spike and sell off in the morning hours - however I did not expect a totally sideways day which means we are not done on the upside. As crazy as it seems when looking at the daily chart, the market may have more left in it.

I did add a small dec 110 put today (at the bottom of the intraday range) so position wise I am around 40% committed on what my final position should be. I am still 100% cash on futures and equities, though keep in mind I am leveraging a bit more then I should via puts - so one could say I am in quite a bit already.

Market has no patience

Its quite interesting seeing the overnight moves here - it seems the market has no patience at all. Generally when looking at corrective moves to absorb sellers and flatten out overbought conditions - the market will spend a minimum of 30% of the advance in terms of time going sideways, generally its even more. Look at the market here? barely even one day as a breather before wanting to continue.

Ok quite important today. USD yet again taking a beating which is helping the futures move higher as we speak. So the question we have to ask ourselves - what kind of move should we expect, how can we profit from it, and how do we protect positions (if you are short you are scared, if you are long you may want to look for a hedge or partial exit).

Initially I had given a high probability scenario to a failed 5th wave, meaning a marginal new high on SPX. I still believe this to be a high probability scenario - however a few things are going against it. One we have light volume and we have to deal with lots of stops just around the 1100 range - once those stops get hit, well you know what happens with all the short covering.

Its 4:15AM now, so we have a bit of time left before cash hours but I do not expect any strong reversals - remember our definition for a stepping day - 1% GAP will set the low within 15 minutes 2-3 points off the open and the first morning high within an hour of the low. This has worked like a charm the past few times so we have to watch this again today.

So what are my scenarios ... start with the lowest probability one.

1) no new high or high at open, sell off at cash hours open - well this to be honest should not be happening today. We have nothing going for this move, limited economic news, forex not indicating any type of reversal

2) failed 5th wave, marginal new high - this move should set the high before 10:00, most likely by around 9:45-9:55 at price levels close to 1107-1110

Now regardless of how high we may go, the close price in comparison to the open will become very important - if the close will be set below the open price. We have a high probability for a reversal - but lets not dream up a bear case here and go for our last, to be honest, most probable scenario.

3) stepping day with a close towards the high of the day on lower volume. For a move like this, we should be expecting a minimum move of 1110 most likely higher. Remember the chart from 2 days ago for our W5 targets.

Will post more updates before cash hours depending on pre-market action, but do not expect much of a change here.

Tuesday, November 10, 2009

Not much to say today

Pretty much what we expected with a corrective move - we made a marginal new high but remained in a tight range most of the day - the close is quite classic for a distribution day -0.01 for SPX.

I stayed out of trading today, tried one scalp but exited within 15 minutes at break even price. I had added a small chunk of puts but waiting on the last position. Those I will most likely add above 1115 SPX only.

As I am typing this I am seeing some big moves after hours (at 7:18 which is a bit odd). Printing 5+ pts above close price around this hour is not all that normal. Going to have to figure out what happened here.

The amazon short I had taken is at the edge of my pain point. 133 price target is my current mental stop from an average of 126.50. Lets see how that one plays out.

Hope you all are doing ok. Say hello every once in a while ... I am feeling lonely =)

Temptations

guys - I just wanted to say something. You cannot imagine how much I have to hold back going in heavier here on the short side - yes we have the risk of more upside. But if there ever has been a time to risk being short.

Ultimately I agree the probabilities of higher prices are very real - but regardless of whether this is a bull or not. We have a very narrow risk margin now when looking at 4+ week positions. Even if the trade does not work out you are within 1-3% (10-30SPX points) of the key upper ranges.

I am holding back here - the old Chris would have gone in much stronger. Believe it or not I am happy not being the old Chris anymore. Yes we have a great opportunity here but its all about managing risk and preserving capital.

10300 DOW

Could it be that we will reach this level today? It would have enough room to make another marginal SPX high or double top. Only 50 DOW points (5 SPX pts) away.

Lets see .... would not count it out as a possibility.

Monday, November 9, 2009

Some more charts of awesomeness !!!


First one is the most insane 15 min chart I have ever seen. Last week was ranges from heaven - I loved last week and banked some nice coin on all the ranges that we were able to trade. Today - the day after we have hit 10+% unemployment we get the weirdest looking chart ever seen. Got to admit - its been quite rare to see something like this with absolutely no pull back and no intraday move. As you know I scalped 3 times today - total of 4.25 points loss - quite scary that we did not have a single retracement of at least 4 points off the highs.

Next ....


That one is quite pretty as well. EURUSD made a NICE overnight move but as soon as cash hours opened - nothing, nada, nichts - just kept on trending lower for a descending triangle that should initiate W4 on SPX. The yellow circle is where I got stopped out today - darn. I had overlayed this with ES - you can see the crazyness of the rally in comparison to the dollar. Where is the relationship? I cannot spot it here ... I had said last week that I believe we are on the verge of a big move in the dollar - could it be that the dollar will go even lower then it already is? I expected strengthening but lets see - keep in mind we are talking about a major trend that had been developing so a trend change of this nature may take a wee bit longer.

Saved the best for last ...


Chart is self explanatory - 2 more closes outside this upper trendline and well. If you are a bear you are exciting when you see this chart - if you are a bull you are excited when you see this chart. OR the other way around - a bull is scared, a bear is scared. It seems whether you are bullish or bearish - you should be finding yourself on the extreme end of the spectrum at the moment with all those patterns right in front of our face.

Out of 100 technical patterns - I am sure we can find 30+ good ones with high probabilities here that will put in a great bullish and great bearish case. Lets see how this will look once the month is over.

We are on for a new high on SPX

Well what a day - never in a million years did I expect such a move but it goes to show how one sided analysis can be. As you know I have been focusing all last week on the upper range of 1074 and counted out any possibilities for what we just did.

(Below chart is in ES)

W1 1026 towards 1058 = 32 points
W3 1039 towards 1092 = 53 points OR 1.66% of the primary wave. It does not get more perfect then that in terms of ratios as this number would represent a perfect W3 target. I am quite mad at myself for not having seen this as we moved towards 1039 with a possible W2 completing and W3 starting. I was so focused on this being an ABC correction move off the highs that was proven quite wrong today.


So what does that mean for us? We completed W3 today and are going to see ourselves in a W4 formation that is just some general whipsaw in a tight range. Minimum targets of course the 23% levels but its possibly and to be honest more likely to see a move towards the 1069 range - a range you remember being key in last weeks trading. This would be a great spot to unload some shorts or enter hedges by turning puts into spreads to minimize risk.

After completion of wave 4 we have a few targets on the upper side - per proper ratios its anywhere from 1116 towards 1131 as the max - however we have the problem of the DOW - DOW is almost at the target of 10300 - which will make the run for SPX towards those upper ranges very difficult. So we have to assume that we may get a failed W5 attempt with only a marginal new high as I had mentioned previously.

Yes - I know I did not want to talk positions but this is a good example of managing around a position. As you know put holders got killed today - on price and premium. As you can see I entered 2 additional positions today for my spy dec put - why did I choose this size? My original position was priced at 3.00 and I now lowered my average to the open price today - meaning, assuming that VIX will remain unchanged if we reach yesterdays open again which also represents the minimum target of W4 I have a chance to get out of this position without any losses or if I want to keep the position (and I do want to keep it) trade out a bit or convert the put into a spread to bank some of the premium if we do end up moving higher. But as we all know - this market has shown us over and over again that plans do not like to work out the way we always want to.

Not what I expected

Well what an overnight session - definitly not what I expected and I added 2 more loosers to my positions. I know I said I will not justfy trades and hope I am not sounding like I am making an excuse here - but as you can see last night presented a low risk short trade with a tight stop that could have played out. Well it did not - and I stopped out with minimal damage. Looking back at the last few months - this would have definitly been a trade I would have kept running without much of a stop as I "believed" we would see lower prices.

Now last night I was confident of lower prices towards the open and that definitly did not play out. I made the mistake of being too focused on what I considered a pull back for today - that I did not even put much emphasis on a 11 point gap higher before cash open. This confidence of course was coupled with having hit our short targets we had outlined last week but no clear plan of what would happen if we do break those levels.

So from here - after having broken an important FIB level (the 61.8%) our next target is the 76% level at SPY 108.30 or ES 1078.

Now the case towards 1016SPX I was expecting is being questioned quite a bit - from a pure charting perspective - we should see a new high - DOW 10300 is just around the corner and this move here could be setting up for a run there. Also keep in mind that the DOW is currently outperforming SPX so we could be making a new high on the DOW while we create a double top or marginal new high on SPX.

Either way - I am going to have to go back to the drawing board now to figure out our next trades. The chances of the open today being the high of the week - lets be honest - very low probabilities so we have to figure out how we can make some good trades this week.