Friday, July 30, 2010

Third try on USDJPY


As per twitter I did two more attempts today at USDJPY. The original one from 2 weeks back was closed out with minor gains. Unfortunately today I got caught again by having my stop a tad too close (yeah yeah but currencies I am afraid for a wide stop). After seeing the reversal I jumped right back in (this time with a much larger position) and hopefully this was it. We have some nice bullish divergences on this pair in addition to the bollinger support and of course the big bullish descending wedge. So three signs of a good long trade here and we are getting close to completing the wedge. Either a breakdown lower or of course a breakout of the pattern to move towards higher targets.

Of course this could be a technical bounce due to quite a run down in the past 3 days. We have to determine how this unfolds during the day today. If we can recapture the 86.45 range before noon we should have more room on the upside, If we stop there and are not able to get above it by mid afternoon it may make new lows below 86 and move towards the big 85 (round and middle).

Two more attempts left after this one. I'll be sure to take some partials this time though to try to balance out the stop from today.

9:55AM: talking about swift reversals lol - recaptured the 86.45 range here and hopefully moving higher. This here could be the breakout of the steep 3 day down channel if we can get to 86.9 next.

3:50PM: well it looks like 86.45 is proving to be quite difficult to overcome. I still think this position is good (well of course I am long) but need to see a strong close above 86.45 on Monday with a test at the 87 range at least (and exceeding todays rally high around 86.7).

Have a good weekend all.

Friday, July 23, 2010

I guess it was blue !!!


Well, much to my dismay we broke out on the upside. Why dismay? Because I was not able to put on my long position again. I had been looking to re-enter my longs that were closed out around the 108X SPX range. Now you know how much I love double FIBs and I totally missed that one. Take a look at the blue circle there - double fibs are areas of big importance and it slipped through my fingers.

Now we have a big band of resistence ahead as you can see from the wide blue rectangle but this is supported by a nice cup/handle, double FIBs and the proper pull backs to break on the upside now. Now we pulled back 50% off our highs before bouncing in the last few days - I hate 50% retracement because you never know what it really is until the move has resolved, now we know.

At this point, I have no choice but to wait for this to unfold towards its upside targets. I strongly believe that going into the weekend and of course our big sunday night many shorts will not want to put a position on here so the only sellers are bulls to take profits, but those are no-where to be found as many are expecting a break here. And yes I know, if everyone expects it - well it wont break. That of course is always a possibility but this market has made a point here - and looks ready to go to the moon even if we have some last hour weakness.

Wednesday, July 21, 2010

Blue or Blue?

Tuesday, July 20, 2010

Am I alone here?

Well, I have been a lot more active in the past weeks and months. I primarily use this blog to share my personal views and positions.

Is anyone still reading here? Is this information helpful? Would you like to see something different?

Feedback would be appreciated. Have a great day all =)

So I was wrong - maybe?

Well, price action since Friday has painted a very clear picture. While I did take a long yesterday I was very concerned with the lack of follow through and as a result closed out all longs again with some decent short term gains. Lucky me ....

While USDJPY is still above my entry price (and what a nice/lucky entry that was) but its forming what I believe may be a bear flag (or bull flag depending on how you look at it). This pair really needs to make a move above 87.2 here in the next 8 hours or we will see lower prices.

SPX wise, we just hit the 50% retracement on ES and hit our magic round number of 600 on TF (russell) twice yesterday and overnight. ES making new lows while Russell is able to bounce of yesterdays low. If we are to break our overnight low we have a good 10 pts to go on the downside before any bounce can develop. Key support on ES is in the 1039-1041 range and this should come with STRONG buying and will also correspond to a 61% retracement so regardless of morning price action I will have big limit orders waiting in the range for futures and etfs.

For today, we are looking for continued weakness, first at our overnight lows in the 1050 range (are we here already again?) and of course 1041 on break of the low.

Another thing I wanted to talk about is the "tripple" channel patterns. Many times when looking at any chart by the time a price channel is hit for the third time either on the upside or downside the trend has an extremely high probability of changing. My longer term readers may remember - 4th time does not happen and generally will lead to a break or continuation to develop into something new.


The dark blue was a retest of the previous low so it could be ruled out. As you can see we had three tests on the upside and 3 (or 4 if you count the re-test of the important low). From here on out - the next test on that trendline WILL result in a break. The market is about probabilities and scenarios that can unfold and its extremely rare for me to use statements such as "will, is going to" - this is one of those times.

IF we are to get back to the lower part of the trendline (which also means a new low) we will see selling accelerate by a HUGE amount - trust me, it will be quite strong and fast but I give this the lowest chance of happening.

Overall I am still looking for a bullish continuation and "hopefully" (here I go again with choice of words) a strong bounce followed of the targets identified above in the 1039-1041 ES range. We may never get there and reverse before but that would also give us a great sign allowing us to get back into longs on fall back to 1075 after the 1085 re-test.

Longer term, the month of July is still extremely important from a weekly and monthly chart perspective. By the end of the year we will be looking back at those specific weekly and monthly charts and know why the market turned the way it will turn this month.

Monday, July 19, 2010

Long and Out

As per twitter I took a nice long position at 1057.75 this morning (after one failed attempt) and closed out at 1065/1068 (50% each). While it is looking rather bullish here I am a bit concerned with many sectors having broken the lows by a bit too much today.

We had mentioned this morning that any break lower needs to get reversed very fast - it did but I am not seeing the follow through I would like and as a result rather go into tomorrow all cash. I still have my FX position - this will be kept for a while but out of everything now.

Want to see how the market reacts between 1080 and 1065 over the coming days to try to plan a new entry either on the short or long side.

Where do we go?

Well Friday was an incredible day in terms of price power. Its been a long time since we have seen such a relentless selling day without any attempts to buy the dip. I have to admit, while I was assuming a shakeout was occurring such price action is extremely bearish.

On a SPX cash basis we retraced a full 38% which can be considered bullish as a W4 retracement. On the other hand when major bottoms are made the second wave retracement of a new bull leg generally retraces a lot less and many times does not even hit the 50% or the "valid" 61% level - again bullish. When looking at specific sectors many have seen healthy pull backs but remain above key support that was broken out of sharply the week before last.

From here its quite simple - a break of Fridays cash hours low and any upside this week should be sold, if however we can remain above Fridays cash low and are able to recapture 1080SPX on a close basis by wednesday we are likely going to see a break of our recent highs around 1099SPX.

The market still has to overcome the bearish weekly and monthly charts - however, both of them will turn extremely bullish if the weekly can manage to take out last weeks high and the monthly can see a close above 1114SPX. We have 2 trade weeks left and a break of those levels will pave the road for new highs to come.

So - believe it or not - a LOT is riding on Fridays low.

USDJPY seems to be working in my favor now, on the first counter trend attempt - could it be? Its likely we may see a retest of the current lows on that pair but it could just keep on running from here. As posted last week, this pair has done quite sharp and strong reversals in the past and if you are able to catch one of them you have a chance for some great gains. Ultimately I am looking for this pair to break out of the 1.5 year down trending channel and continue on the upside. First target is 92 and after that re-capture the 98 levels.

EDIT: If we are to see a retest of 1058 it can only be "allowed" today and needs to reverse above 1064 within 120 minutes of cash hours.

Friday, July 16, 2010

Knife catching

as per twitter just took a long ES @ 1059.75 with one point stop ... been watching this relentless selling here and was waiting for the final push lower to enter a long scalp. Lets see if this has any legs into the close - doubt it and probably wont get more then a few points if I am lucky.

Shakeout in progress

I believe we are currently in progress of a bullish pattern by shaking out weak longs that had entered positions after the 1085 break as well as trapping bears that went short in the 109X range. The internals of the market are not supporting a drop of the size we had seen today. Anyone who follows me on disqus may have read my comments this morning on TTW as liquidity had been removed carefully to create the 10 point drop in 30 minutes. After the drop was done liquidity had been re-added. Another supporting element is the weak negative tick for such a selling event which further supports a drain in liquidity to push the market lower.

As you know me I generally do not talk about "devilish market maker" scenarios but this here seems quite fishy. Get rid of weak longs, trap the bears, break into 110X and make the weak longs rebuy as well as force bears to cover which will ultimately lead the way towards 1130 SPX.

Targets on ES today could be anywhere in the 1062-1066 range as a valid 4th wave to propel the market higher. From a time perspective this looks now much more solid for a proper 4th wave compared to yesterday.

I am also considering re-adding my longs that I had closed last week as we are currently under my exit prices which is great.

12:24PM: this could be it.

USDJPY - counter trend attempts

As per twitter I just took a long in USDJPY with tight stops. I am allowing myself a total of 5 attempts here over the next 3 trade days to get a first part of a long position build there. I know we broke important support @ 87 here but this pair has provided great sharp reversals in the past, if one is nimble and can absorb a few attempts of being stopped out there is some nice gains to be had. Ultimately I am looking for a retest of at least 90 from the eventual bottom/reversal point.

Thursday, July 15, 2010

Excuse me !!!

Well, highest tick since 2001 ... not much more to say there ...

Tick confirmation in

"On the other hand, if the LOD is in we will see ourselves back at VWAP by 1:30PM or a bit earlier even."

"11:18AM: Look for tick confirmation here. Considering that we had a -1200+ tick today, we need to get at the minimum an equally strong tick on the upside (1100+) as another confirmation for LOD."

Well we hit price, time and confirmation targets again. Really wish I had tried another long this morning after my 2 failed attempts. A bit frustrating but we can say with great confidence now that we are opening up the price range towards 1100+ SPX. Maybe not right away but price action here is very indicative of higher prices and less selling pressures.

Updated Channels


I have to admit, this channel chart we have been using for many weeks now is working perfectly. I have added a new channel on the right hand side as we are close to breaching the down trend line here. This of course would fit very nicely with the chart from earlier with the W5 targets and of course will bring prices nicely above all key averages. Its interesting to see how prices have reversed so strongly from the lowest uptrend channel step that was broken as we breached 1060 a few weeks back. You can see how prices reversed very strong and got themselves back into the previous up channel. Its key now to remain above this trendline on a 3-day close basis.

Bad trade for the month

Lets hope this was my bad trade for the month lol. Tried catching the falling knife this morning without much luck (as per twitter).

You may ask why was I so reckless? Well, I really expected that we keep this GAP open for a bit longer and run into the 110X SPX range first especially after breaking 1095 on a cash basis consistently without strong reversals. I know it sounds like an excuse and hindsight a break of yesterdays low of course made it obvious that the GAP would likely be filled. Sometimes, being glued to the screen and trading on "impulse" can burn you. While it was just a few points (due to tight stops) its still frustrating having giving up money when there was clearly no long trade until the GAP was filled.

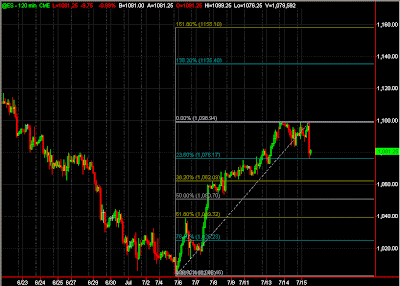
Back to charts, we just hit the perfect 23% retracement with our low today which makes this a W4 and opens up the price range towards much higher prices.


Now on the long side it is very possible that we shake out some of the weak longs first here and make a marginal new low around 2 pts lower early afternoon. This should come with lower sell volume and should be followed with a strong reversal. On the other hand, if the LOD is in we will see ourselves back at VWAP by 1:30PM or a bit earlier even. Getting back to VWAP would be quite bullish and validate that our LOD is in, at least for the day.

11:18AM: Look for tick confirmation here. Considering that we had a -1200+ tick today, we need to get at the minimum an equally strong tick on the upside (1100+) as another confirmation for LOD. Market is being helped by EURUSD here so any weakness there could spell more trouble and further downside. Considering EURUSD is up substantially already its a bit difficult seeing how upside can develop without FX support.

Wednesday, July 14, 2010

Covered positions

Covered my remaining shorts from yesterday. As per twitter I had cut positions size before the close quite a bit and covered the rest now at 1085. No loss and small gain - thats all that matters =)

Playing it a bit safe here.

Tuesday, July 13, 2010

New Positions

As mentioned via twitter went quite short here via ES, ETFs, puts. Avg price around 1096-1097 SPX (except one small batch of puts I got earlier) - stops on all at SPX 1099.

Minimum is a retrace back towards 1085 from here, could develop into more depending on how we approach that price range. Just so you know, its very likely that this position will get closed and reversed back into a long. Price action today has been quite bullish but we are "smacking" against strong resistance so some pull back is to be expected.

Channel Magic

Really not much more to say. Good enough for me to leg into a small short here (not futures).

Monday, July 12, 2010

Low Volume chop zone coming


The last time we rallied off major lows we had a very similar price pattern. Take a look at price advances over the Moving averages and the formations we are seeing on MACD (got our cross today).

From here on out, we should continue to chop and as mentioned previously test our final target of 1085 (we got close today but got denied). I do believe we are going to break through the 1085 this week but I am not sure and rather be proved wrong with profits locked in.

Took Full Profits

Been stuck in meetings since this morning but wanted to give an update. I took full profits this morning on the spike up between 9:45AM and 10:15AM. Sorry for not giving real time updates but did not have a lot of time today to post.

I believe we have a very high chance to see higher prices into OPEX here but due to work I rather lock in profits now. Had a great run off the lows at 101X with a nice sized position. At this point going to sit tight until we see a retracement (which may never come and the market may just run on to make a new high). The past few weeks have shown us surprises on both sides so I am not counting out a bearish scenario here but am looking to get positioned on the long side.

You may ask why am I taking full profits now instead of a hedge or more partials? Well to be quite honest I am not trusting this upmove from last week - it came too fast and looks more like a big short covering bear raid - could be wrong but there will be other chances for us to get positioned.

Will probably not post an update until mid week with more charts.

Friday, July 9, 2010

Partial Profits

Took some partial profits on my big long positions from last week.

Too fast - what to do?


I have to admit I am quite surprised at the price action over the last few days - yes we all expected a rally but not like this. Making money in bear markets is fun since you see profits fast while bullish moves take very long to unfold but being patient pays off.

I am not complaining since I am quite long still but I would much rather see a red close today, and even spent more time below 1074 - heck spend a week there and I am happy. The problem with steep low volume advances is the coming retracement - many times those steep almost vertical price moves get retraced very soon and very strong.

We are nearing some key areas of resistance - of course the channel chart, moving averages not only on the daily but also on shorter term time frames (60 min chart has 200ma right here). With the weekend ahead I am actually a bit concerned and may enter another larger trade towards the downside today, nothing crazy but with a delta negative position (meaning P/L goes up as price goes down). Waiting to see what we do towards the close today but this is too fast too soon. We could easily gap down on Monday and bring a lot of selling with it - and if selling is strong and 1058 taken out bulls need to be extremely concerned.

Price Target reached

We got to my 1074 SPX price target this morning on a very slow grind. Considering the bearish action on EURUSD and the slow grind higher here I hedged myself again @ ES 1070 a few minutes ago as mentioned via my twitter feed.

Keep in mind that I will not take profits on hedges and only let them stop out break even (read more on my trade lessons on hedges on the right hand side).

10:56AM: we should be making a new LOD in the next 2 hours. Should only be marginal but could develop as a retest of yesterdays LOD. Wedges have a tendency to break down quite fast so watch out here.

Thursday, July 8, 2010

Contrarian View

Been browsing through the blogsphere this morning and it seems almost everyone is going short here and closing longs. I am not so sure that is the right move quite yet and I think a short below 1040SPX would be a lot wiser. I am currently hedged (almost 100%) against my longs but I am not ready to close out quite yet.

We are quite overbought here on the short term and we need to give the market time to absorb those "sellers" hence my play to get back towards the SPX1050-1055 levels as the first stop. Depending on how we get there it will tell us a lot more on whats coming but I do believe that we will see 1085 at the minimum before seeing below 1040.

Also take a close look at our updated channels. MACD is showing us more upside after getting back to zero. Channel wise we are currently in the middle so its a bit more likely to pause slightly before re-attempting to upper ranges. Just imagine the next low volume rally based on the many new shorts that are entering the market - we have seen yesterday what happens when people are forced to cover.


10:27AM: it should turn lower right here or very high chance of a new HOD by noon.

Continuation

Well pre-market showed us the market is looking for continuation this morning. This should halt either at 9:55 or around 10:20 in terms of time. Target could be 1074 SPX.

9:44AM: top came in early. Went short ES as a hedge (in other account). Looking for 1050SPX next.

Ratio Analysis

One pattern that has only been seen at bottoms in the past 18 months is a 4 point pattern move when looking at Advance/Decline Ratios.

1) breach of the 2.5 ratio where the bottom occurs
2) retrace on the ratio by the first "buy the dip"
3) followed thereafter, another attempt to break lower in price but making a lower high on the ratio
4) and lastly followed by a strong move below the 1.0 ratio

This pattern has only ever occurred at previous bottoms, I marked each occurrence with vertical lines and each time in the past it has held up as a bottom with a decent size rally to follow.

Jul-08 12:30PM: just went over to evilspeculator and realized he had done the same exact analysis in one of his protected posts yesterday. I had been waiting to post this chart since Sunday (as I had indicated the day before) to wait for the pattern to confirm - quite funny that two Germans spent their weekend looking at this same chart lol

Wednesday, July 7, 2010

S&P 3.13% Up and Germany lost

Well, good news and bad news. Germany lost today vs Spain and market (and my longs) are up a considerable amount. I guess I should not be too upset.

Breakout

Well, we broke yesterdays high and are finding ourselves distributing now above the 1040 range. As bullish as it gets. From here I see more sideways consolidation with a possible bear fake towards the 1031-1033 range during the afternoon.

I will be watching the Germany game this afternoon so I will be gone after lunch. There is another very interesting chart coming tonight that has thus far confirmed major bottoms in the past 18 months, a chart that is also confirming this as a bottom. But it needs to be taken with a grain of salt as its highly likely that we have changed our major trend and if its pointing down for the remainder of the year, those signals will likely not support our 1010 lows as a bottom.

Will the real W4 please stand up?


Question remains if we completed a 5th wave on our lows last week or we are yet to complete W5. Both of the blue circles are valid W4 - question is - did we complete the impulsive move down or are we just getting ready for another 50 pts of downside?

Tuesday, July 6, 2010

Some charts

Double FIBs

I had posted this one earlier on TTW:

This here is one that struck me as quite important, whenever you have double FIB price levels we have to respect them quite a bit more compared to single FIB levels. One of them is the big all time high to 666 and of course our last rally off the lows.

As we are looking at a longer term chart we have to assume that the resolution (if at all) on any upside will be a bit stronger. One of my biggest challenges in 09 was the understanding of the break of 38% fib levels as we kept on rallying in 09. This break paved the way for more upside and broke my views of SPX480

Dont worry - got lots of bearish charts too but this is what currently supports my positions so I wanted to share it with everyone.

ABC Time

This is another bullish beauty. This is a time study from top to B top (if this is a correction) to final C low.

2009 Jun-Jul: 15 days top to top, 5 days to bottom
2010 Jan-Feb: 11 days top to top, 4 days to bottom
Now: 40 days top to top, 9 days to bottom

We are fairly close time wise however our correction has been a lot stronger in terms of price and overall duration. One argument for this length of the duration of course is hitting an important price point of 61% of the entire bear in addition to our crash lows that have severely damaged supply and demand in the 1040-1180 price range. We can also do other studies on those previous ABCs for more accurate time relationships but this one stuck with me a bit more.

More coming this week.

What the bulls need !!

(or should I say what I need for my longs lol).

Close needs to be above 1033SPX today or we will have some quite severe consequences for building a bull case here for the short/mid term.

EDIT: will be posting lots of charts in the coming days, many bullish but also some really juicy bearish patterns.

4:01PM: We did close green but not a victory day today and feeling quite uneasy about being exposed on the long side. Today can be justified as a great trapping day for both sides of the trade. Overnight action with a new low on ES, bull gap up with big retrace, bear fake with the gap and run higher and the tease on breaking the 61% intraday retrace by a marginal new low just to rally slightly into the close leaving bulls and bears without any real trade to put on for a swing. 50+ point intraday range is not what a "healthy" market should be doing but on the other hand its the much needed quest for finding the right balance of buyers and sellers. Remember bull markets do not need the volume, bears do need volume to confirm lower prices. At the end, I am a bit shaken again and not quite sure of what the market wants to do.


Friday, July 2, 2010

Inside Day

Well a nice inside day today, even with a negative close this still has a lot of bullish potential. Inside days after prolonged down trends generally resolve to the upside on the next candle (as a GAP higher the majority of the time).

We have a lot of bullish signals at the moment, key support, extended oversold conditions so even if we just get some consolidation we should make it back to 1060-1065 at the minimum. Of course there is always the potential of a big down move and GAP below major support which would require us to open below 1000SPX on tuesday. This could be very news driven and we have to be careful and watch the markets on Sunday/Monday via futures and FX.

Again, enjoy the weekend and see you all next week (or Sunday night).

Back again

Looks like the LOD was just made. A break here and we go down strong but very low probabilities. I added a tiny bit on the long side here just now at ES @ 1011.50 but stops at break even for this chunk.

1:14PM: need to take out 1016 in the next 8 minutes. Look for TICK to get confirmations

1:35PM: market struggling here to confirm the LOD. Lower volume on selling now so thats positive but need to get above 1016 to keep this protected.

1:48PM: next target now ES1020.50

3:27PM: off by half a point lol. Closed the longs from earlier here. Keeping everything entered yesterday.

Happy 4th !!!!

Will be away from trading all day today (world cup). Keeping longs in place with stop at break even. Job numbers in 5 minutes and its very unlikely I will change anything on positions even if the number disappoints.

Have a great long weekend everyone. Happy 4th !!!!

Thursday, July 1, 2010

Special Event: The big one

Well, as my longer term readers remember I capped my trading capital back in Nov 09 due to "stupidity of my views". So far have only used funds once half a year ago with a failed attempt. I am dipping into this account today and will place some bigger long orders likely at the close. I have a decent enough buffer from my other accounts that went long at the bottom today but will be committing a large amount of my funds to a long position using various instruments (primarily ETFs).

Trigger for me to buy is a positive close so if we see green today - I will be buying.

3:41PM: will hold back on big positions. Not as clear anymore as it was earlier, I know we could rally big from here in the last 15 minutes but I am not convinced.

Whats next?

Ok received the confirmation a bit late, market wanted to trick some of the players but 1008 held for now - Low is 1010.91 - close enough for me.

The channel picture from before got a perfect touch on the lower trend line with nice bullish MACD divergence. I am a bit hesitant to add more longs but depending on the afternoon session I may add to existing long positions. We are not out of the woods yet as volume on this advance here is quite low - meaning we are not seeing much short covering of buying in comparison to our selling pressure. What I am looking for next for the day is a TICK in the +1100 range with the SPY 1-min chart showing a minimum of 2+ million shares traded (per minute) as part of a 5-8 pt buying "spree". This would be the final confirmation for me to add to longs.

In the mean time, playing it very careful still. EURUSD saved the market from collapsing today, and USDJPY hit an important support range in the 87-88 range. I have to admit I did not expect 88 to break there, nor did I expect us to reach 1010 this soon. As a result of this accelerated time frame it is still very possible that price targets on the downside are not yet done. As you remember I trade time quite a bit, so we still have 2 weeks left before we are supposed to be at our first bottom - could this be the "crash like" bearish scenario we had identified two weeks ago? Still very possible but at this point I am looking for upside in the markets at least for the remainder of the week.

As I am typing this I see TICK making new highs but no volume confirmation quite yet. Overall the low should be in and only capitulation like volume (check SPY 1-min chart again with 5 bars above 3 million on the downside) can bring it lower.

12:12PM: ES 1009.50-1010.50 needs to hold here, this would be a nice retrace to indicate a new wave structure if our low today was a short term bottom. IF we do break 1009 ES today we should drop below SPX 1000 briefly (but with a close above 1000) as we will get forced selling. That means a potential of another 15 points today again (intraday low of at least 30 pts down). Probabilities are very low at the moment for this BUT a break of key price levels will bring this as a 70% scenario. So be careful if you knife catching like me.

12:39PM: +1151 tick as expected. We should now see our volume confirmation soon with some big buyers stepping in.

12:43PM: there it goes again, we got our "8 pt" buying spree, strong volume in 2+ million shares on SPY in one minute and of course our TICK. Could not have worked out better here =)

12:52PM: I am going out on a limb here, IF and thats a big IF this is a real bottom, we will close above 1040 today, if we close between 1033-1040 we should have a GAP up tomorrow to open above 1042SPX. I would almost dare to say we are getting to 1040 today.

Updated Chart


As always same trendlines. I added the 1029/1006 trendline that goes back for various support ranges.

10:48AM: waiting for confirmation with TICK above 550. Confirmation needs to come within 8-12 minutes from now. Confident it will hit.

11:00AM: no confirmation so keeping stops extremely tight for a retry later on.

This should be it ....

went long again here .... 4th time is a charm right? We will have to see.

Almost there ...

Getting very close to a short term bottom here. Within the next 15-30 minutes.