Tuesday, December 29, 2009

Just a quick comment

Hope everyone is enjoying the time off. Looks like we are in the process of getting our end of year melt up here. Whenever I look at low volume pushs to new high I am getting very concerned with more upside. I remember last year I was trying to short a bit too early and ended up having to carry quite a draw down but the end of jan showed big gains on the short side.

Not sure if this goes into the "I learned my lesson" type of category but I am looking to enter shorts very soon, not today, but most likely in the first week of january. For now I am 100% cash with the exception of my USDJPY trade - unfortunately USDJPY looks corrective here so I am thinking we may push on to break through this resistance cluster or at least test the upper most ranges (which also means I am getting stopped out).

Other then that, I ask you to look at the monthly charts for AAPL and GOOG. Wow is all I can say - I think once you see what develops there you will concur that some pull back is very likely - considering that those 2 are the bull pushers I would expect the market to follow.

At this point a correction will be good for both bears and bulls, we shake out some weak hands, figure out how strong support is on volume and have a chance to see what 2010 will hold for us.

Statistically we are at bullish extremes, more so then ever before, I would dare to say those extremes are stronger then the bearish levels we had seen back in march which ultimately resulted in this amazing move higher. The month of January at least will give us more signs of what the year has in store for us.

Till then, enjoy your time away and have a good jump into the new year.

Wednesday, December 23, 2009

Happy Holidays Again

I am out - probably will not hear from me till end of the year. Have a great holiday and enjoy the time off.

Farewell 2009

More FX obessions


Again talking about USDJPY. Sorry that I have been focusing a lot more on FX at the moment. It will change once the new year comes. FYI I have not made a single SPX based trade for the past 2+ weeks and been only focusing on FX (EDIT: with the exception of course on taking equity positions but only certain picks).

Ok I have marked a serious area of resistance and support with the blue rectangle. As you can see this has been a point of battle over the past year either trading above or below.

Currently MACD divergence on the daily is quite high so even if this does not move lower we need to continue sideways to get rid of the overbought conditions. The channel is the one I had been describing in the past and we are lining up nicely with the big support/resistance zone and previous down channel. So thus far it makes it 3 indications that we have some serious resistance ahead.

The last and final observation is the fact that every advance of the declining lower trend line ended up with a parabolic or overthrow like ending move - its even more visible on the 60 min. This again happened here with the last 3 days having been quite strong.

At this point my stop is close above the peak high now with minimal capital being risked ($200) and possible gains of a move towards a minimum of 88-89 ($3300 gains at 89). If the bottom is in on this currency pair its ok, we break important resistance rally some, and eventually will come back where we can go long. Either way a good setup.

As you can see risk/reward wise FX offers amazing setups and since you have so many different markets it pays of being patient and waiting for setups to come to you (instead of me chasing SPX).

Tuesday, December 22, 2009

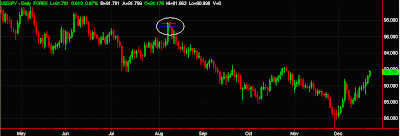
USDJPY - Attempts


As mentioned I am looking at this one very carefully to be able to build a longer term short position. This one is a bit tricky since the majority of my FX trades had been based on more shorter term positions. I had made quite a few attempts in the first few weeks of my FX world a few months ago but not successfully.

At this point I am trying it again, a bit different though. This one is actually a very nice setup. I tried short yesterday towards the close as the 60min had a barrier it could not get passed, stop was rather tight on this one as we still had a bit more risk at another jump higher (thanks USD).

We are seeing the same pattern again today, first spike to mark the high and a few unsuccessful attempts to break through. Its nice since it allows you to build a position at the edge of the range with a tight stop. This time around the position is split with a tight stop again above the range and one thats a bit further away (while I sleep things happen you know).

Just for reference, here is my last long term attempt on this one ...

Got a nice short close to the top (blue line) and stopped out right at the top (red line). Not going to let this happen again this time around.

Again, I will be making quite a large "2010 start" post with a lot of focus on FX. One can say this has been my new "playground" with very little capital exposed and surprisingly quite a nice amount of gains.

USDJPY


Something to consider. I am going to watch this one closely for a reversal.

Friday, December 18, 2009

EURUSD


Just a chart =) Long this one at the moment. I may hold on to this one for a while and do not treat it like a short term FX trade (got in at the low of the day)

Just a quick thought

I was reviewing LOTs of charts last night and I have to admit, we have quite a few stocks stuck at resistance but what really surprised me is that the majority of stocks that have broken down are either at key support or have formed a bullish descending wedge over the last 2+ weeks.

The dollar is strong but its also stuck at resistance (with EURUSD trying to build a base). So what that means to be honest is that we either start a BIG correction with key support failing on many stocks (and therefore negating the bullish lower wedge on many) and stocks stuck at resistance failing to break through

OR

the more likely scenario to be honest is a breakout above resistance, rally from support and dollar yet again dropping with EURUSD going higher.

In terms of odds, I have to admit, being carefully bullish still seems the way to play this especially when looking at seasonality. On the bearish side, we can find just as many justifications for the market to stop here, break support to get to next support level and fail at resistance - however the only thing that is the wild card in this entire thing is the dollar. Weaker dollar will yet again give an excuse to continue risk through the carry trade.

I am still on the fence and quite honestly, do not know where this may turn we have strong signs for either side here, and it truly is one of those times where the market is at a brink of setting up for a larger 2-3 week move here.

Thursday, December 17, 2009

In Holiday mode

Well, there is not much to say about the markets at this point, still the same old range without any clue for direction. (I just took a quick long at 1096 ES FYI).


As you guys know I have been very active trading FX using EURUSD and I have to admit I am a bit ashamed I have not been able to profit from this move lower here. What a move this has been, 3.5 months worth of gains wiped out within a matter of 1.5 weeks. staggering to be honest.

I wanted to address a question that was brought up last week in regards to FX. When it comes to FX, those markets behave very different from standard equity markets - yes they all follow technical patterns just like any market but the moves can be much more drastic and swift - due to the high leverage in FX (even if you trade small sized lots) one HAS to respect stops - as you can clearly see form the above chart - once a currency has setup for a strong move or breakout there is no stopping it. On the above chart its especially visible - there is no chance to get in on the short side unless you have a much wider stop which is quite difficult to manage.

For me personally, being new to FX, on the above chart it has been VERY difficult to get a short position as I am used to tighter stops and EURUSD has given traders like me no chance to get in and profit from the down move. Its a matter of style and my style does not fit well with the above chart.

Now whats very interesting is the weakness in EURUSD and no effect on the market - if and when the dollar makes a turn and retraces or resumes the primary trend (if that is still the trend) we can expect equity markets to move higher. Seeing such a large decoupling is a bit worrying and can be a preset to a much larger correction in equities - however due to seasonality its quite difficult to commit too a larger short exposure during this month - at least for me it is.

As I will be getting ready for XMAS I may not be around much for the rest of the year so if I do not see you before ....

Happy Holidays for everyone

Monday, December 14, 2009

No Comment

Yeap no comment - there really is not much more to say as we are still range bound. The edge goes to the bulls at the moment as we had 3 attempts on the lower side and 3 on the upper side now being the 4th attempt to go higher. Based on charts - probability on breakout higher is the highest.

Its opex week as well in the lightly traded month of december. At this point I am staying out of the markets probably even for shorter term scalps until the new year. Lets get 2009 over with so we can start fresh for 2010 =)

Thursday, December 10, 2009

I promise


For some reason the combination of both of those pictures ... it just makes me cry a little. I mean what a market. Just sit back and take a look at this daily chart of SPX. Incredible.

Wednesday, December 9, 2009

Consolidation to go higher?


In order to remain flexible for short term trades one has to look at both bull and bear side. At this point I am in slight favor of a bit more downside however we have a good risk/reward ratio for being carefully bullish at this price range.

I outlined the chop zone range breakout confirmations in the long blue rectangle. As long as we remain in this range we cannot be sure of direction. We can even go all the way down to the close on Nov 9th and still be considered in the chop zone.

Now here is whats interesting. After entering the zone of naked option holder death we had seen a repeated pattern.

3 days on the upside, 2 days on the downside. Now on our 3rd attempt we remained in the upper range for 5 days and attempted to break out. We failed to make that happen through an overnight GAP above resistance and reversed lower but did not sell off right away. We are now back on the lower end and its closing on the second day.

So the question we have to ask ourselves.

1) was this a failed breakout and we are done? (done short term wise)
2) or, we did not have enough distribution at the top of the range and needed to come lower one last time to be able to break the overhead resistance.

Both are still very valid and even if we break lower here towards the 1070 range, this still has enough power to push through the upper ranges as we will be quite oversold once we reach 1070.

No decision yet ... but as mentioned I am 51% on 107X first. If we do breakout higher tomorrow then I think we can be confident of higher prices and a break of 1120. But let the market the market show us where it wants to go.

Tuesday, December 8, 2009

A quote from a fellow blogger

If you follow mole over at evilspeculator (not just because he is german too). One of the readers just posted an interesting comment.

"Tops tend to be processes while bottoms tend to be events."

Comment made by "bubble jeopardy".

Great stuff !!!

Anyone still here?

Balanced Gap-less cash only hours

Sometimes I like to play around with the GAPs a little bit to focus on what I consider "balanced cash only hours" - meaning for every GAP higher, balance out the chart with the GAP lower. Looking at our GAP and chop zone above 108 SPY we had 3 gaps higher and 3 gaps lower. I am only using the significant gaps here not every day. If you were to reverse those based on the number of gaps in this zone you get the following chart.


So even with the GAPs removed this is one ugly looking chart but also a great indication of whats going on in terms of buyers and sellers. So lets take a stab at it.

1) there do not seem to be any new buyers
2) there are no sellers either

So what is it then Chris? if you know the answer please let me know because I have no idea how this will resolve. Anyone who is trying to make a call here - be my guest and assist us in trying to figure out how this may resolve.

The point I am trying to make - we HAVE to wait for a breakout before committing to any side here.

Refusal to commit to a trade

Well, what a day, we had a nice gap down but after the GAP occurred the market yet again remained in a narrow range. As you can see I have been focusing a lot more on FX and even there I keep it small - in a way I am trading SPX through EURUSD.

So first point on FX - as you know I have been trading EURUSD quite a bit in the past 2 months with with my main focus on being positioned short, though I did not shy away from any long chances. However after we had tested the 1.51 range I have been looking for a good short position and I am a bit ashamed to admit that I missed the boat on this big move we have seen here. I had been too focused on the strong support at 1.48 that I really was not ready for a move lower. The EURUSD appears to be completing a proper 5 wave structure and I am kicking myself a bit for having missed this great move lower here - however, did not loose money overall so I am not too upset.


Keep in mind FX markets generally have a much larger 5th wave so we have to be ready for more downside, unfortunately downside that is not tradeable - so it will take a few days before we can find a great entry again on this - whether its long or short. We are currently at important daily support here so we have to see how this plays out.

Now SPX wise - what can I say, the only way to get a proper reward for a position is during overnight moves and I refuse to gamble here on SPX.


We are still in the chop zone here and today appeared to be a nice attempt to move out of this zone that again lacked the follow through from any bulls willing to take profits or a bear moving in. Yes I can see bears getting excited but look at this above, there is nothing to get excited about, there is no follow through and no real direction. Take a look at the previous declines, we had some proper follow through and all you see here is total whipsaw for both bulls and bears. As long as we remain in this range it will be very difficult to get a proper position that I dare hold longer then a few hours. Even a breakout on the upper ranges has to be approached with care as this rally is looking rather weak here to be quite honest and after 9 month of upside - who wants to be the last one on the ship?

Seasonality wise - its December and everyone expects December to remain neutral or bullish - again the contrarian would say thats exactly what they want you to believe - you all know what I think about the concept of market trying to inflict the most pain to most players - simply do not believe in it.

So what to do from here? I still feel the best position to maintain is small in size, with tight stops and minimal risk exposure. Why gamble for a 10-15 point move when during a normal trend 15 points are just a small fraction of what is tradable.

Micro = Macro


The funniest thing just happened to me while watching the 1-min EURUSD chart on my current long position. I almost crapped myself when looking at this chart. Look at the similaries of this 1min chart compared to SPX 2 year daily chart. Its looking like we are up to July now on the last peak of EURUSD. I know its not the same, dont get me wrong but the similarities are amazing. Lets see how this one plays out in the next 60 minutes and we should know where SPX will head till march? quite funny.

FYI - the 9:00AM zone looks just like that 880 failure to go higher back in July - the one that cost me a LOT of money. Maybe its those horrors from back then that play with my mind ....


Open at key trendline

If we remain at current levels we will open at a key trendline. Now we are down 1% which should give us a stepping day again, however, in the past down gaps at least have been filled partially while up gaps run away.

I am not sure what to make of the price action quite yet. We have seen big moves in the dollar but SPX is not following - it does not mean dollar and SPX always have to work together but considering that we have seen great strength on the dollar we are actually up on the market all things considering. EURUSD is yet again at a key trendline as well with decent support but we did break the 1.48 range so this may qualify as a real break.

If we do not see higher prices within the first 15 minutes we can be sure that we will see the 1084 range possibly today. For me to engage in any longer term bigger trades we need to see a break of this range and a retest on a separate day. So for today, I am actually looking for a long position in the morning hours (long EURUSD at the moment) and potentially a short on retest of 1110 ES.

Lets wait it out and see how it develops. Remember my charts from yesterday, we do have a bit of support on the lower side but in my opinion its quite weak as the price action above this support is not what I would consider "stable".

Monday, December 7, 2009

Nothing much changed


Well we are still in the same old range and nothing much has changed so it seems. In my post this morning I was talking about the market burning off overbought conditions. I wanted to show you one of my daily desktops that I check at the end of the day. I mean really ... how much more screwed up can an index look? I am used to seeing those type of almost irrational moves on individual stocks but never on a broad index.

Left side = dow daily, you can see we have good support anywhere from 10200-10300 but the price action above this range is so weak - well it will take a splice through that support and its done. Looking at the MACD though, it did make a higher high so thats rather bullish on the DOW. We also switched back into negative divergence on the MACD (same on the others) while being a mere 10 points away from the 12+ month high - incredible.

Now the center one, SPX, no new high on MACD, and that bolling keeps squeezing every day that goes by. I think this must be the narrowest range I have ever seen on a bollinger on an index. 1116-1085 - another incredible one.

Now last, spy on the right hand side. Mini wedge in the big march 09 wedge. Would not be surprised to see a breakout of the small wedge to retest the march 09 wedge around the 1140-1150. Interesting to note on the spy chart is the volume - again dropping volume and big volume spikes once we approach the edge of our ranges - either on the top or bottom.

Enough for tonight. Not much going on - quite upset at being stopped out on my GBPJPY short from Friday - stopped out right at the top. I have to admit - this one seems to happen quite frequent on FX trading ... (though I did nail my EURUSD long from friday to sunday night at respective low and high so I guess its a wash).

End of Year

Well, what a week we had last week. Nothing much has changed from a big picture perspective but we did see a significant move on EURUSD (the dollar).


As you can see we are still within the trendlines we have been using for the past few weeks and have broken important support. Not only did we break the 50dma (first close below trendline on friday) but we also gave up the important 1.48 and are slowly creeping back above it. We made a lower low today BUT MACD divergence (not shown) on the 60min is pointing to recovery higher (meaning weaker dollar).

Now equities wise, looking at the weekly chart we have continued to consistently make higher highs and everything appears to be bullish.


I had made a post on Friday about this topic and was quite active also on other blogs indicating that while this appears to be the best case for a pullback for the bears - we should not ignore the big picture. If this were any other months during the year I would be quite bearish in terms of positions I am looking for, but I have to admit its quite uncertain. On the daily we know it does not look that bullish after all - but consider this, the last time we were at important FIB level (38%) it took 3 weeks to break through, we are now at the 50% levels and have been operating in the same range for 4 weeks with the market making marginal new highs on a weekly basis.

This sideways action we have seen for the entire month of november and into december could be the consolidation needed to go higher. Take a look at when we first breached 1100, our indicators were quite overbought on the daily charts, looking at today, we have turned into a neutral zone even while making new highs and not selling off.

Please do not misunderstand my comments as bullish, its rather meant as a way to describe that one should remain neutral or "carefully bearish" until the market resolves itself.

Personally I believe when looking at charts we have 2 possibilities going into Jan-march time frame - a run towards 1200 SPX or the start of a larger pull back that should bring us into the 930 range by March 2010. I will post up more longer term charts this week to show the potential moves.

Currently we are still range bound between 1084 and now 1120. A very tight range and a breakout to either side should give a move of at least 20-30 SPX points.

Other then that - nothing much to say, its december and I would advise to stay in scalp and very short term mode unless you are invested outside of this range (short at the current top) or long at or below the 1084.

Friday, December 4, 2009

Blogsphere Emotions

I wanted to share some general thoughts on whats going on in the blogsphere. It seems everyone is ready to accept that we topped, the majority of comments I see are about longer term positioning for puts and shorts, and that we are finally turning lower.

As much as I agree from a fundamental perspective (well you all know me, I am as bearish as they come, even during a 10 year bull market). However lets review some facts:

1. We made a new 12+ month high today
2. We are still up on the day
3. We are within 1% of the most recent high swing

All of those facts still point to an intact uptrend - even if we move lower towards 1016, this is still a fully valid uptrend as much as I hate to admit it. I am very surprised to see bearish traders come out stating we are going down and this is it. Maybe this is the pre-stage to the last bear slaughter we will see this year and a xmas 2008 like rally to end the year or this is really the move lower.

After I had changed back to my short term system, my head has become a lot clearer and I am looking for pattners based on price and not based on opinion (well a little bit heh). We have many bearish divergences and the past 18 trade days on SPX look like from some very thinly traded penny stock. I mean seriously look at those daily candle sticks on SPY. Incredible. Not very bullish at all.

Now, me personally, I was ready to be 100% short at 1016 when we had tested it the first time with a target of 880. We are now 100 points higher, amazing, but the same still applies, I am ready to be 100% short at 1016 - AFTER we retest it from breaking into triple digit SPX - think about it. Yes I would love to be short from here to get all the way to 880 from 1110+ but come on - we all know we never get 95% of a move in position. The point I am trying to make, I see in many other traders now how stubborn I was before, wait until the trend really changes, then get in and position yourself. Its probably the biggest lesson I learned this year at my first attempt at IT trading (remember I used to be short term only).

Lets see how this plays out.

Thursday, December 3, 2009

Monthly Recap: November 2009

Well, I am still a bit down with the flue but I wanted to put out an update for the month of November. As mentioned it was an up month yay. Positions from nov 5th till today gave a total of around $2K in gains - I made another $2700 with 2 other trades in the first week that I posted in comments but that was before the "new beginning post" - I am still going count it though.

Now, while it was an up month, I have to admit it was a lucky one that I came out on top as I pulled myself into the greens within a matter of 2 days thanks to our dubai craze. On a total capital of $60K (though never invested more then 30%) thats not quite as good of a return as I was expecting but acceptable.

As you can see the only "real" losers were my longer term position attempts - one would say I learned my lesson before but it seems thats not the case - over $4000 in losses from longer term puts, overexposure and not sticking to my short term trade system - mainly dec spy puts (longer term attempt), AMZN & POT short (overexposure).

If those would have been smaller losers (like they should have been) the month would have been quite a bit better, could have should have would have I know but it just goes to show that not sticking to your system can be devastating.

I do not expect to be doing much trading during this month with holidays and everything else so I am not going to be such a self critic here in December.

One small change on accounts, I am merging the capital for equities and options into one since its a bit easier to keep track of it.

Soemthing not right in the mothership


As much as I "enjoy" watching this sell off (though not participating) I am skeptical as always. Where is the dollar? I know we had said that we see more and more decoupling of both of those markets but would really like to see some follow through on the dollar as well with this move.

A real retail Trader


I had a great day today trade wise. Locked in some nice profits and got into 2 positions I would like to hold on to a bit longer. However, this lesson again goes to ALWAYS use stops no matter what it is you are trying to do.

I had entered SRS at the double bottom, as I had not traded SRS in a long time I realized that with such a low price, the moves are not always favorable for proper stop and scaling mechanisms as the bid/ask spread on such a low price etf will cost you quite a bit.

So I rolled into IYR as a short instead (smaller position and of course less leverage) but I also closed out SRS by hand. So lesson here - EVEN if you roll your capital into another position, do so by properly using sensible stops. As you can see straight line up after I had closed out by hand. Yes I am in IYR as well but it just goes to show that stops should ALWAYS be used ... again ALWAYS.

Another chart of interest


Take a look at this peak advance ratio. We are decreasing our angle on every consecutive peak we are making on SPX. Even more interesting that we had been consolidating in a very narrow range for almost an entire month now and every attempt to move the market higher is being faced with selling pressures - but not enough selling pressures to move the market lower.

We are coiling and continue to stay very narrow in our daily ranges, the challenge now is finding new buyers that will commit to the markets at those price levels, buyers that need to have a very long term focus.

We have 2 ranges ES wise. 1115 now as our peak (a break here and we have a move into the 113X range) or the 1082. IF we are to get back to 1082 I think we will see a break lower and finally some real profit taking (not just protective put buying on open positions).

EDIT: one would consider that after such an extensive coiling pattern the following breakout will be very strong - however, a breakout on the upside will face the same challenges its facing now, while a breakdown lower will actually work "easier". its also possible as always that the first move out of the coil could be the false move to reverse back even stronger. its a difficult call for sure - one that no one seems to know the answer for. I'd give it 51 down and 49 up (which is quite incredible that I am assuming a 49% chance to move higher from here)

But looking at the above chart - not looking all that bullish - in addition to that SPX is racing against the march trendlines and eventually the market is going to have to give this trend line up. This can be done through side ways price action as we may be seeing here or through larger retracements.

Holiday and being sick

Well last week I was quite busy with family in town and starting this week with a summer flue and having to catch up with work is quite a battle. (yes a summer flue in Miami sigh).


I wanted to show you this EURUSD 60 min chart that is begging for another breakout. Lets review it first. We created what seemed to be a bullish lowering wedge or a descending triangle first (blue circle) - we broke out on the upside as we had anticipated and had 2 nice retests of that falling trendline (green circles). Now we seem to be building and ascending triangle that is begging for yet again another breakout to the top which would indicate higher prices yet again. I am ignoring the dubai craze on this ascending triangle (second green circle) since it recovered before cash hours were reached in the US markets.

Looking at this we have good support at 1.504 from the previous top and the ascending trendline of the triangle. If this were to resolve to the upside (which has a high probability) we could be seeing another 30 pts on SPX and possible break of 1.52 on EURUSD (though I do not believe we will break that range on EURUSD)

Wednesday, December 2, 2009

Failed breakout?

If we do break 110.73 on SPY its very possible that we just saw a failed breakout.

Tuesday, December 1, 2009

MIA

Sorry for being MIA - some more personal issues to resolve. Will make a post shortly =)