Friday, May 29, 2009

Which GAP will it be?


Will definitely be interesting to see how this "W" formation will resolve on Monday morning.

The thing I thought I would never ever say on this blog ...

The moves here from 3:59PM to 4:01PM.

Not only did they run MANY MANY stops. They also ran all the limit short orders and then took out the respective stop for each of them at the same time.

Take a look at futures after hours. S&P futures jumped to 930 within 15 seconds and then came all the way back down to 920.

I have to admit, this is something I have not seen in a while. There was one incident during this rally a few weeks ago where they ran quite a few stops pre-market with a huge 8 pt 30 second spike (one that took me out as well) but this is just crazy.

Quite a squeeze that was for sure. Now that we closed on the upper ranges of the line after one entire month of distribution we can GAP up on monday above key resistance and hit 945 at 9:46AM Monday morning.

Speechless .....

Trendline

Its been hugging this trendline since yesterday. Even a break here on the downside needs to be treated with care and could be a nice setup for a short term long to take out the upper range.

Another one to the list ...

Yesterday
Quite a volatile day yesterday. We opened right at key resistance and remained there for almost 30 minutes. This was a clear sign of buyers not able to make the gap stick. We sold off hard and seemed on our way to the key 880 range.

"For the bull case to continue a rally is needed before reaching 880."

It seems the bulls knew exactly what they had to do and get the bears out of the way. We had all the signs for further drops - low volume rise showing a retracement, however, buyers managed to turn the market around and prevent further drops from happening.

Today
"The bears have strong momentum on their side now and are setup perfectly for a clean break of the 880 range. If bears fail on this attempt and "chicken out" it will pretty much show defeat giving the bulls the upper hand to take this market wherever they want to."

Well, maybe not wherever they want to, but at least another chance on the upside. Me being a strong bear I have to admit I am devastated and frustrated - almost too wounded to try the sell side again. Many other sellers are feeling this same type of attitude. As a result the bulls have quite a big advantage now. It is my feel that if we do see another attempt on the upside today, we will succeed as bears will be waiting on the sidelines.

Bulls have the upper hand yet again, while it seems this changes on a daily basis further continuation today is likely with a break above 920. Bears should not be reattempting the sell side here and more bulls should be coming in with buying interest to take the market higher.

If the bears can manage to turn the market in the first 1.5 hours of trading we could see follow through if we manage to break 898 on the downside.

Support and Resistance
We have similar numbers as Wednesday so not much has changed. There is a small adjustment on the lower range but other then that same thing.

936-938
923-924
912
907-908
898-901
892

Side Note
I wanted to thank schismatic for the note yesterday. Thanks for reminding me again of my stubborn nature, helps hearing the obvious sometimes =)

Sam - "The question is what will it take to convert you to bull. your line in sand. I think to cause the maximum pain everyones lines in the sand will be blurred."

I have to admit, I have never been as bearish as I am now. I do not want to turn this into a political post and start talking here for the next hour about my issues with whats currently going on but I cannot see any value on the long side - not with where we are in terms of valuation and price. I have to face the fact that I missed the rally.

Now what do I do from here when we have had one month of sideways action with me chasing a point of view? Well its time to stop chasing the point of view. I had mentioned I will be taking a bit of a break, a break from my view and focus a bit more on short term trading. My P/L is loving when I am in and out of a trade the same day. Every attempt to build a longer term position shows drops in my P/L. Its been that same story for the past 2 months - got to learn sometime.

Thursday, May 28, 2009

Wishful thinking ...

What a roller coaster of a day it has been for me. Its very unfortunate that this week emotions have come back so strong for me. The traders worst enemy is chasing a point of view with full commitment when the market tells you otherwise.

The amount of mixed signals we have seen this week is quite incredible - just reviewing my entries today - I have to admit - they all made sense. Of course hindsight is 20/20 and you can always say after the fact that they were horrible but I traded with signals and indicators that I have used very successfully in the past - yet the end of the day close was probably the worst I have had in a while. I blame my emotional attachment on this one.

Either way, we were not able to take out the 880 range - we got close in terms of price but failed to make a stand.


Taking a look at this 880 to 930 range - of course in hindsight its a sideways move without any clear direction. But it seems every day has given strong signals to either side here - bearish and bullish - back and forth.

Reminds me very much of the Mid January to Mid February range here - only key difference is that back during that time frame I did not trade any long term positions but just went with small 10 point moves - much easier.

Either way, just wanted to share some of my frustrations. Whether you are a bull or a bear - this here is very frustrating with the amount of mixed signals that are given. If you were a bull before 880 then you have nothing to worry about - if you were short above 920 you are in decent shape too - unfortunately I am stuck in the middle here as I had closed out a nice move off the 920 range and have been trying to re-enter but failing miserably yet again.

75 points !!!!

Just did some random counting for the day ... I do that every once in a while on large swing days but I think 75 is quite a lot .... at least for this rally.

Amazing times we are in ... now can we please stop this and make a move. Up, down, does not matter, just pick a direction =)

Reversal or distribution?

Yesterday
Another strong reversal day that continues to put pressure on the bulls.

"907-908 = combined with the 910-912 this range has been an important turning point and a range to allow distribution to take place. So watch this range very carefully to be able to differentiate between distribution and or buying/selling for a new range."

"Bears on the other hand continue to manage new buyers and do not allow them to break our previous upper ranges above 920"

We traded in this range for the majority of the day and any attempts to break to the upside was quickly reversed by the bears. While we had strong up moves in terms of price from the previous day, just as anticipated the bears took control in the upper ranges and bulls lacked any momentum to try to make their stand.

To take it one step further the key ranges of 902-903 that I had assumed would be protected heavily failed horribly. I had mentioned in the comments that as part of my rules a support point becomes resistance when we have a minimum of a 10 point breach of this level. This occurred yesterday and gave the bears enough buffer to treat the 900 range as resistance now.

Looking at our lower highs we can safely assume that the game plan now is the 880 range, an important point for bulls and bears.

I wanted to quote another comment I made yesterday in regards to support and resistance levels.

"When the market is dealing with a strong resistance point on the upper ranges that it attempts to break we will see consecutive tests at this range with uncontrolled/impulsive sell offs that find support at various ranges but will always lead back to the same upper resistance range. When this occurs the chances of a break of this range are very high.

This is not occurring here, we have quite the opposite. After our first run towards 930 we have been dealing with the same support range at 880 with uncontrolled and impulsive buying moves that stall at various ranges (924, possibly another impulsive move now that may stall anywhere from here to 924). The key is that we have consistently retested the same exact support range of 880 whereas the opposite moves have been to various other ranges - almost uncontrolled (many divergences for volume and other indicators).

So taking this into account, the chances are a lot higher here that the market is setting up for a break of this important support and NOT for a break on the upper ranges. If we were working on a break of the upper ranges we would be seeing similar action as last month when we kept on testing 870-880 with impulsive sell off moves towards various support ranges (never the same).

So in summary - I favor that the market is setting up for a break of the 880 and NOT a break of the 930."

Today
For the bull case to continue a rally is needed before reaching 880. The closer the bulls get to the 880 level the lower the chances are for continuation on the upside. On a close basis we are only 10 points away from this key support so bulls need to step in strong off the open.

The bears have strong momentum on their side now and are setup perfectly for a clean break of the 880 range. If bears fail on this attempt and "chicken out" it will pretty much show defeat giving the bulls the upper hand to take this market wherever they want to.

Support and Resistance

907 = key range at our consolidation zone that should hold as resistance

898-902 = a bit wider of a range here but we have to account for some buffer at the 900 level. A break of 902 will bring us back into the consolidation zone.

880 = of course - nothing to be said here

869 = first stop after a break of 880 that should provide some weak support on the intra day

856 = quite a strong support level that should not be broken on the first attempt. From here I am looking for a retracement back to our key range of 880.

Wednesday, May 27, 2009

Step away from the computer Sir !!!!

License and registration please.


My trigger happy day trade account shows total insanity. Take a look at those stops =)

Just cut the mouse cable in half ...

I am not really sure what happened in the past 2 hours. I guess its the one day of total trading rule regression I get once a month - its out of my system now so lets make some money. Lucky for me it was just some toe dipping but man was this painful especially seeing where we are selling off to now.

Talking about chasing a trade here ....

Back and forth

Yesterday
Well, we had quite a run on the first day back from a long weekend. The market was ripe to take out the 880 on this 4th attempt just to fail yet again and come in strong to break into the 900 with a very bullish close. There was no looking back after the morning action and the market remained in a very tight range without any pull back.

Today
The bulls have the upper hand now and here can make their stand to break the lower high pattern to take us to a new range. Price action yesterday was very strong indicating further continuation at least in the morning hours. I had mentioned that bearish indicators fail to give bears the signs needed. The bulls have consistently managed to drive prices higher even with many bearish divergences developing. This has been the game for the past 2 months and has not yet changed. To further support the bull case the past 3 weeks have been a great sign of distribution to absorb any sellers and remove many of the overbought conditions.

Bears on the other hand continue to manage new buyers and do not allow them to break our previous upper ranges above 920. Bears have broken the uptrend for the first time during this rally with strength and continue to dominate on the upper ranges with selling. However follow through on key support ranges is lacking and any attempt at breaking support will induce short covering and new long plays. Long term long positions carry great protection and the bears have yet to drive fear into many longs.

Support and Resistance

936-938 = indicating a new high and of course major resistance. Expect a sell off from this range to bring you back into the low 900 range.

923-924 = the previous attempt we have made on the upside after visiting support. A retest here should give some pullback but should be setting up for a new high

917-918 = the bears need to make a fight here and cannot allow prices to continue higher. Any break of this range has a potential to go all the way to the 930+ range. So watch volume and momentum carefully on this break

910-912 = previous close and key price point

907-908 = combined with the 910-912 this range has been an important turning point and a range to allow distribution to take place. So watch this range very carefully to be able to differentiate between distribution and or buying/selling for a new range.

902-903 = as mentioned the bulls broke through yesterday with strength and will continue to defend this key range here. A break to the downside will bring us back to 880. The bulls cannot let this range fail or the chances for a break on key support become very high.

Trade Plan
Trade plan for today is sit and watch. We had a strong price move yesterday and we need to wait to let the market show us direction. Did we built a base to enter a new trade range on the upside or is this the last attempt of the bulls before we end this rally.

Side note
It is rather interesting to compare this bear market rally to previous rallies. There are some key differences - differences that have already started to put doubts in my mind in terms of the direction for the next few months. Bear market rally tops are swift and bring fast reversals. This has not yet occurred here and could be an indication for the longer term of this market. There are not yet enough signs for me to invalidate my outlook for the year but the bullish patterns are making a strong case here.

Tuesday, May 26, 2009

Talking about divergence

"No Recovery Yet, Home Prices Post Another Record Drop"

SRS - UltraShort Real Estate ProShrs -10.3%

Long weekend ... no charts

Well, I promised myself to post some updates and yet again I felt personal time was a bit more important. Apologies yet again.

Currently markets are trading around the same price point as we closed on Friday last week. We have had some slight tests of the lower 879 ranges yesterday due to the Asian market craziness and this morning.

It seems the bears are not able to break this market down below the key range of 870-880. We have now had 2 consecutive tests at this range during regular market hours and 2 tests in the past 2 days during futures action. Unless the bears can take the bull by the horns we should be seeing more upside. During our very light volume trading on Friday we did give the 895-896 a test just to fail towards the close. Based on the action we are seeing we should be giving this range a test today and make an important decision here for the remainder of the week.

As I had mentioned in the comments previously I am looking for a close this month around the 871 range. The monthly close should fall 10 points above/below and will give an important sign of things to come. Looking at my long term forecasts from beginning of March we are nearing my time points for this rally to make a move towards the downside. While I had a major miss on the price components we are still moving correctly in terms of time components. A monthly close at this key 871 range will set up the market for a fairly wide range towards the downside with a minimum target of 780 for the month of June. However, lets not get ahead of ourselves here and let the market show us the direction for the coming month.

Support and Resistance
902-904 = a key test at the 900 range for resistance. As you remember the market likes round numbers so a break of the 896 should lead us back towards the 902 range. Watch for the market to potentially stall at the 898

895-896 = the first target I am looking for on the resistance side as it represents the high of Friday

869-871 = a number you have seen me refer to a few times. If the market is able to break the key 880 range we should see a small bounce of this range. Hitting this number will most likely lead us to the next level of support.

856 = this number starts a cluster of close support ranges so a break here on first try is very unlikely. This support would give a great long play towards the 870-880 range. So if you want to be short, do not chase it as you will get your chance.

I will most likely revert back to my old blog format that gives the previous day review, daily review, support and resistance numbers as well as a trade plan. Some of my older readers may remember this format and I have to admit, not sure what changed here. I guess too many random thoughts and comments I felt I wanted to share.

Friday, May 22, 2009

Yawn .....

just woke up from a 4 hour nap (just kidding) and looking at the market .... emm nothing has happened. Time to do some house cleaning on my positions.

Here they are ....


Yeap - boring day and my accounts want some new greens soon. Please give me more buying.


Kind of hoping the blue was a fake breakout and we trying to fill that GAP here to go for the yellow circle.

Have a good weekend all. I may or may not watch the close here.

Ready for a long weekend?


The last time I had posted this graph I had mentioned one of my rules to not change trend lines around which I had "violated" here once but kept the same after that initial change. Glad to see those same lines working well here. Center line used as a quick stop that should give enough support to bring us back into the first area of resistance around 898-903. We could get very lucky and possibly see the 907-912 range here but I doubt we will make it this far.


Here is also on update on the VIX showing a new reversal. As you can see my old triangle line was violated just to get reversed within 2 days. I added a secondary line here showing that it still falls within the overall pattern if you include the new year buying craze.


Here is another view on the 60-min. To recap - we have 3 targets, 898-903, 907-912, 918-920. It is my feel that this rebound should be over quick - it could even be over before the day ends today so look for early signs of reversal here.

I had closed all my short positions yesterday and am looking to re-enter soon. Will probably add first chunk at 898 and continue to add as we go higher. Keep in mind today is Friday and we will have a long weekend ahead of us here. Its going to be very telling on how the market holds up here in the last 1.5 hours of trading today.

Regarding twitter. The blogger gadget had caused some web site issues. I will be looking for a new gadget to add so for now I will keep position updates here in the comments.

Thursday, May 21, 2009

Site Problems

I have been having some site problems due to the twitter gadget. Temporarily removed until I can figure it out.

Problem was related to Internet Explorer somehow.

Being Bold .... 869 LOD

Another market crashing song

Since we started it yesterday lets do another one of those cheesy market crashing songs ... thats what they should be queuing up on the NYSE floor shortly.

What we are setting up for ...

Reversal day


High volume, strong price move, MACD stays negative. Being a bear I was hoping for a close right at 912 (maybe a bit below). A close below 912 was wishful thinking. A close below 907 RIGHT at 903 (you remember the importance) is significant.

Lets see how it plays out. Futures are down a bit but we have jobs data this morning so we have to see how the market reacts to this. UK outlook lowered, Fed outlook lowered. Its quite negative around us now.

From a bearish side, we either get our sell trigger today which would lead to sell off right off the open or an orderly decline that should retrace back towards the low 900 range not to exceed 912. Just like in the past if the market comes in with strength it needs to move to 880, possibly lower, to add enough buffer to keep any retracement below 900 and stall just like before at the 898. The first 30 minutes will tell the story for scenarios today.

On the bullish side - well, I have problems seeing how we can maintain the uptrend here. However we are still in the channel (barely) and need to make a move now to the upside, so the bulls have the first 30 minutes to make their move here.

Wednesday, May 20, 2009

What does colbert think about the market going up?


Just sitting here watching the 1 min charts with my favorite market crashing song playing in the background ...

Click here for more drops

Perspective ...

Being such a strong bear myself you know that I love selling myself on my views and find whatever justification I can to support my positions. So here it comes, at the expense of being completely one sided (which I try my best not to be so take this post with a grain of salt).

1) I see many traders going long here. Look over on Slope of Hope. This is not meant as a negative towards Tim. He has made more money then I can ever imagine - but his post today has a bit of an emotional tone to it.

2) Look at xtrends. I have been a reader on this blog for about 8 weeks and today was the first time he approached the market with caution and adding a more objective longer term view to the tone of "we could be going higher on the short term"

3) New Money, First trade = I just gave you $100K and today is the first day back on the market for you. I am asking you for a 30% return within 6 months. What would you do here? Regardless if you are bull or not - I am going to say you would be very careful on the long side and only hand pick specific leaders and sectors. Otherwise as an objective investor I would dare to say you would be short on the mid term before making a long term decision of direction.

4) There seems to be no end to the upside here. Even I have stated that bulls are in control - or are they? Look at volume, that to me does not look like control. Price control is there for sure but momentum and strength continues declining day after day.

So ask yourself - blue pill or red pill?

More Pain to come

Well, yesterday we had a bit of a chance to my anticipated direction. While we managed to close below the 912 range we still closed above 907 which is important support at this point.

I have to admit, the moves of Monday and Tuesday were a bit of a surprise to me as you could see from my post yesterday. As you remember from my old quotes "if the market does not do what you thought change your strategy" - yesterday was one of those days that changed the outlook for me. We were setup nicely for the correction to start yesterday but held the ranges.

Many have said yesterday was a distribution day to go higher. At first I was hesitant as distribution days normally involve much needed profit taking with sideways action with a slight down trend. Around noon we had signs of this occurring while S&P moved up many of the sector and trend drivers (financials, etc) were trending down showing divergence to the main index.

In the past I had mentioned about the need to move inventories from major funds. This is not yet happening but we had perfect tape buying throughout most of the day while sellers stepped in at the afternoon. We should continue seeing increased selling pressures now as we continue to move through the ranges and funds need to move those positions.

So where will we head? To be quite honest, the market is setting up to make a new high here. Bear market rally tops will rarely get retested as a double (or triple top). We will either see a stall before hand, or a new high. The market had its chance to stall Monday and Tuesday but seeing that we managed to stay above 912 for most of yesterday, with a close above 907 and an intra day test at 916 we have to assume of another push up to test the important 920 and in my opinion break this range to make a new marginal high. When I say marginal high it is referring to a very minor breach of the previous top ranges on low volume and with quick reversals.

So what to look for today? On the low end we have to worry about the 908 and the 912. At the moment we are around the 915 range so expect a GAP fill attempt - it is my feel that we will manage to stay above 910 during this move. On the upper ranges of course the 916-918 range is important that should provide resistance on the first test, however, I do expect to see a break on this range and move into the low 920 range. Here is where the market will have to make a decision.

If I was currently in a long term long position that I was able to manage to break even or profit I would hold out for higher ranges before an exit. I think many are still of that same feel as CNBC is doing a great job at expressing "nothing is what it seems" and continue to pump up the markets. Its such a sentiment game at the moment and fundamentals are left on the sidelines.

So in summary - remember that bear market rally tops will not get retested, a stall before or a new high - those are the only scenarios. At this point a new high seems to be more reasonable. The bears have one last chance left today. If we close above 912 we should see higher ranges for the remainder of the week.

Tuesday, May 19, 2009

Right and Wrong = recipe for disaster

Quite a frustrating start to the day. As much as I love to tell myself I made some good calls for the day I have to admit its frustrating when you do not include them all in your trade strategies.

As stated yesterday we were looking for a target price of 916 for a continuation. While we reached this target it was done so under different conditions. As described in comments continuation for a price target should not occur coupled with a sell off. We moved off the low of the day thus far towards this price point with good strength.

To top it off, the time target for this move was hit as well between 9:55-10:05 (low of the day at 10:01) and to make matters worse I had described in the comments that this time target may not be the high and could be the low as well.

In addition, my trade strategies were focused 100% on the 5 wave move that was violated today as the retracement target of 61% was exceeded.

So now its time to try to figure out what the next move will be. At this point of course the 920 test has very high probabilities. This in turn will give us some great new signs of direction. While we had major divergences on the up day yesterday we are seeing continued moves into the same direction which makes it a bit more difficult to figure out where we will head.

On the one hand we have little volume so a breach of 920 should not occur on the first test, however, my line in the sand of 912 has been breached yet again and we are not seeing any type of reversals to get below this range.

Overall, as much as I hate to admit it, and as much as I should be getting my bear cape off, we are continuing in the up channel in a bullish manner. Divergence or not, price is telling us a story even if volume is on the other side.

Rest of the day for me is sit and watch. I hit my daily loss limit as I was shorting (and of course violating my rules by moving the stops higher and higher).

Just an update on the chart posted yesterday


Just an update on the chart I had posted yesterday. I have one ground rule for charting, once I forecast a channel or a pattern and the market is not playing within that pattern I am not allowing myself to move whatever trendlines needed to make that same pattern fit - this applies to the down trendlines I had put in yesterday. I do feel I have reason to expand them here considering we had such an up day today and a huge GAP, additionally I also drew the center line at the 50% level as another guide here going forward.

Futures wise we are already trading at 916 so we have to see if this range holds up. I have to admit, a test at 920 would be quite bearish (EDIT: thx Kat - I meant to say bullish here for a test at 920), but could be explained with the fairly large GAP yesterday and possibly another GAP today. Exceeding 920 however, GAP or not, should bring a new high.

So in summary - we are well positioned today to try to get some decision whether or not last week was the start of a new move or just some large distribution to the next important support level to continue higher.

Just to restate from yesterday.

"I have 2 time windows for a change of trend for [today] - 9:55-10:05 or 10:25-10:35"

Monday, May 18, 2009

Another chart of divergence heaven ...

Per CNBC - largest up day since March 6th (or May 6th - only caught it while walking by - a huge up day nevertheless).
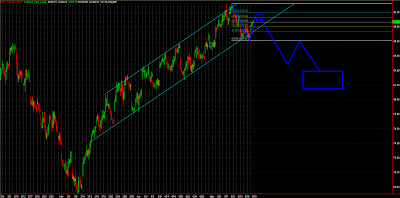
White - TINY volume for such a strong price move - like lowest volume. Anyone who also frequents corba's market view blog - [Prices up, volume down = most bearish]

Green - bounce off the RSI support level

Yellow - MACD daily divergence still below zero, chances of getting another move into positive divergence are VERY VERY slim (but should not be ignored as a possibility)

Blue - Momentum not confirming up move.

As per comments ... "Tape buying is getting very very very very (again very) tiring ..." on the other hand thanks for letting me improve my average prices.

Waiting for futures to tell me about tomorrow. However looking at charts such as is. Stepping days will give you another continuation the next morning. Since we reached my price targets of 907-910 today on yet another crazed buying event we need to assume 916 as another level for continuation tomorrow.

Another comment worth mentioning.

"I call days like today "stepping days" ... cause they kind of look like steps. Break into new range, sideways within that range, break into next range, sideways in that range, etc.

Coupled with low volume this is setup to go one more level up. However, looking a bit toppy here, once it breaks back into previous range it should continue to the bottom of that range, however, do not like trading days like this."

I have 2 time windows for a change of trend for tomorrow morning - 9:55-10:05 or 10:25-10:35 - that would be my perfect bear case. Will take anything else though =)

Some targets


Here is one view based on my getting in-out of positions. That's a typical 5 wave with wave 2 hitting the 61% retracement level. This is also inline with the new downward channel I had described and shown in today's post with the outer edge around the 907-912 range.

This move was one of the main reasons for me to exit my shorts this morning, the low volume stepping day just gave more confirmations.

Really should have seen that on Friday but I was a bit hopeful on the overnight push through support at 880 which is a contradiction to my previous views where I stated that I would be disappointed if last weeks move off the 880 was everything the market had left.

Breakdown or rebound?


Well I put a few key areas together here on this chart. First off we are still in the channel as you can clearly see - I hear many saying we have already broken it and I still do not quite believe it yet. We have been able to hold the 870-880 range as support and should continue to hold it now.

There are 2 easy scenarios to look for - a quick run up to 895 in the morning hours on low volume that should reverse quickly to break this range - or the more likely scenario of a continuation to see 900 again.

On the above you can see 3 key ranges - range one is the current support that we have not yet breached, the current upper ranges of 898 and the danger zone all the way above 920. A break of 898 will most likely lead us back to 907-912 so watch your shorts here carefully.

Friday, May 15, 2009

No update today

Sorry running late again and too much work today ...

Will post intraday updates in comments.

Thursday, May 14, 2009

Added to positions

Added another 25% to positions. Will add rest at 902.

New Positions

SRS @ 22.76
SKF @ 45.77
SDS @ 59.92
GEW UM @ 1.68
GEW RM @ .87

25% size for each for full position

Futures holding?


Just another quick update. Futures have been holding yesterdays low but more downside pressure exists here. We are about to breach the low here which would confirm a move towards 870-875 on S&P 500.

If we open at this range here for futures more sell off will occur to hit the 870 range and possibly touch the 868-869. If we can get ourselves above 885 on S&P500 at the open we should have a great chance to get to my upper ranges of 895+

Where is ze volume?


Ok the bears have an important test ahead of them. We have made our cross on the MACD daily AGAIN and are back to zero. This time around the chances for a cross into negative divergence is VERY high. The chances of another turn into positive territorry are very unlikely - however this rally has thaught is nothing as as it seems.

Additionally we have hour 20 day moving average on the bollinger band that is also coupled with major support via previous peaks in Jan/Feb/April as well as strong FIB levels. Volume wise I am not seeing the confirmation for bears quite yet - I had mentioned in yesterdays post the importance of selling by funds something that has not yet occured and was also confirmed by a fellow reader in the comments. Its as much of a sentimental game now as it is technically.

I have to admit I have learned more in the past 2 months then any other previous time during the market. Money management, risk management and sentiment - all of them major components that needed an important refresh in my trade style.

I had closed out half of my SDS position yesterday - I am willing to take the risk of loosing 10 points here even if that means I have to re-enter at worse prices.

Regarding ranges I am currently looking for. We have a wide range of various support areas ranging from 870 to 880 - the same ranges we had been dealing with as strong resistance last month. Regardless of what I feel long term - for the market to slice through those on the first attempt would be disappointing. We should expect some support of this range and depending on volume we may get ourselves back into the high 890 range. I do expect the 898-901 to be tested once support has been found. Whether this occurs today or tomorrow remains to be seen.

Even with my previous SDS position I have not yet fully invested myself into this leg down - a wounded bear I may say. My major goal at this point is to get myself positioned 100% for this move to come. I am a bit cautious still but there is not much from holding this market back to go lower here. I will be posting position updates and new entries via twitter and a new post here so you can see what I am doing.

Plan for positions at this point is the same as before:

From a distribution perspective here is my split for this long term move towards September.

- 70% SDS position
- 10% SRS
- 15% SKF
- 5% options for various stocks/price/expirations

I will slowly scale out of SDS on support and add more to SRS/SKF on retracements. My anticipated targets for the SDS/SKF/SRS combo are as follows:

- 50% SDS position
- 20% SRS
- 25% SKF
- 5% options

This should be completed by the time we break 800.

At this point I am looking for above 895 to re-add SDS and start the first SRS/SKF positions.

Wednesday, May 13, 2009

Why I closed out 50% of SDS

Updates

Posted quite a few updates yesterday and today. If you are following me on twitter I would appreciate some feedback in the previous post. Other then that ... lots of reading today.

Twitter Updates

Ok I have not been as active on twitter recently, so I wanted to get some feedback from my twitter followers. My initial intention was to use it primarily for pattern updates and possibly positions. At this point the primary use has been longer term positions and not day trades.

I have no problem posting whatever is going through my head but it may hurt some followers if they use it for trade advise or strategies.

So from your perspective - what do you like seeing or prefer to see / not to see?

- mid and long term position entries
- day trades
- random thoughts about market moves

For day trades please understand I will not be able to post stops/exits and position management in real time but it may be helpful to see when I am planning a short term entry. Who knows ...

Any comments on this would be appreciated !!

Are futures fooling me again?


Ok here is SPY 30 min for the week including pre-market action. As you can see we held last week Tuesdays low and saw a sizable bounce, more then I expected. Futures are currently trading EXACTLY at the lower trendline I had posted yesterday. So a retest of yesterdays low should only give us a marginal bounce to test mondays low.

I had mentioned that during option expiration week we should trade within the previous weeks range. Well we are on the edge of breaking this range. We held at 896 yesterday and have one last range left here at the bottom at the 890 (last week mondays low). The targets on the upper ranges are marked in blue representing last week monday/tuesday high and the last level at around the 918-920 range on S&P.

As you remember breaking the 870 range we needed a lot of buying power to bring us well out of this range to be able to use the 870 as support once broken. The same can apply here, a break into the 890 may not be enough to leave 900 behind as resistance. A bounce off the 890 should break 900 again on the upside to get back into the 906-908 range as the top. So we have to see.

Watch volume on the 1-min carefully today, also have another graph up for 5 min candles to see if we get indecision on the bounces. Also use RSI as I had posted yesterday so we can determine what kind of bounce we are dealing with.

Position wise. I am still holding SDS, and started buying into my GE September puts (GEW UN). I will keep on adding to this position over this week and possibly next for a total of 4% cash exposure (meaning 4% of my cash tied up in this option). I may do another set of puts for the previous expiration (GEW RM) to get some better value for my money in case we will not see a new major low and stop at the 716. Other then that still waiting to pile into SRS and SKF. I will scale into those slowly and use some of my remaining cash and possibly some of my SDS position for this as well. While my SDS has an average price of around 77 (without including money I made from hedging so its much closer to 70) it is a winning position over a 3 month time frame.

Market is getting weaker overall, however selling has not yet stepped in. This is totally normal and should not be misunderstood for the lack of commitment from the bears. To go back to my old statements - who really needs to sell? Those large inventories are waiting on the sidelines still waiting to be unloaded - why has this not occurred yet? Fund Managers know you cannot catch the perfect top or bottom, so they assume a risk of 5% off the top (930) with the potential of making another 5% (run to 1000 range). A break of 870 on the downside will then trigger selling to occur from this level. 870-880 is a key range for any bull at this point - a break here and the dip buying is over.

Tuesday, May 12, 2009

Made up for slacking today ...

As I did not have much time during the day today I figured I post up some more updates here.

Just some Random charts and observations
How the futures fooled me today
More Taunting
Holy VIX Patience

Trade Patterns
RSI trend confirms
Five 15-min bars

How the futures fooled me today.

Twitter at market open: "Very high probabilities of a 930 test and possibly a new high. Not trading it long."

Comments at 9:36AM "get ready for a new high today. I know its a contradiction to my previous statements but you have to respect the market."


Well a contradiction it was .... yellow dot is where I thought we would breakout higher in this channel to rally back to 920+.

They really know how to scare every bear out there and make us afraid to even think about shorting. This pattern and this overnight action, required a lot of guts to go short off the open there.

Again sorry guys for such a wrong call, I mean really wrong.

More Taunting


Market does not want to break down. Ever after blowing above the upper chanel for the first time its not even giving us a chance to get back to our lower level trendline. Still trading in the parallel to the wedge lower line - still steep uptrend.

Holy VIX patience !!!!


Talking about really pushing bears to the limit. Uncle VIX really does not want to break out of this huge bullish lowering wedge. I mean really. Its driving the bears mad seeing this type of pattern without a move.

You know how I love trading triangles and wedges at the 15%-20% closure points for a breakout. Not this one here. Its taunting us ....

Trade Pattern: 5 15-min setup


Cannot take credit for this one. Saw it done by Robert Hoffman (powercharting). This pattern is pretty easy to trade, probably one of the easiest.

Five 15-min bars. Lets assume its down move. 2 red 15 min bars, 1 green for distribution, 2 reds to follow. Same the other way around.

Used this pattern on Monday as you can see here. 10:00AM, got in at bottom, saw the 2 greens, got one red, doubled position size on the 4th bar start. Normally I am looking for the 4th bar to not exceed the yellow/red line (previous bar close/max) - however all the way to the blue line is still valid (second bar close). Combine it with the previous posts on the RSI levels and you have 2 ways to confirm a move higher.

While this specific example does not have the standard 2/1/2 type setup it occurs very often - so start watching it in the future and you will see how often it occurs.

Here is the same time frame on 1min so you can see RSI as per first pattern post.


Note: yes those other 2 trades were rubbish I know. Cannot win them all.

Trade Pattern: RSI for confirmation of retracement or new range


I figured I start posting some of the patterns I use heavily for day trading. As mentioned I tried a few times today to catch a bounce. As you can see I kept on trying - I have a tendency to go in before confirmations. As a result I get stopped out quite a bit as you can see. However the risk exposure for each trade is minimal. As each entry normally consists of 2 positions - one to get into the money and then a position double on strong confirmation. The first "try" is normally with half or less of the intended size - this way I built up enough buffer to go in strong once my second confirmation is made - if I am too early on that second size position I would still be in the greens without having to worry about stopping out - makes sense? (sounds kind of weird writing it out)

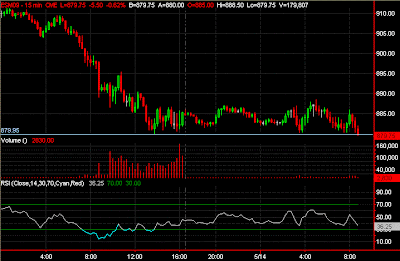
I use RSI on the 1-min very heavily to let me know if I am dealing with a retracement or a new range. Today was a prime example of how it was easy to see on the RSI. The above graph is of futures (ESM09). RSI in the morning hours till noon never breached the 60 range and as a result we continued dropping lower. I circled them red here.

Now the low of the day I went long again primarily due to major support being down there, again a small position but worth the risk. The bounce of this range got RSI above the 60 into overbought conditions - it retraced back down and stopped at 40 on the low side, rallied again staying OVER 60 this time and one last drop to 40 yet again - here is where I doubled position and let it run towards my 903 target.

Downtrend, bounce with RSI below 60 = retracement
Downtrend, bounce above RSI 60 = high probabilities for new range

Uptrend, sell off with RSI above 40 = retracement
Uptrend, sell off with RSI below 40 = high probabilities for new range

I know RSI is common sense but I wanted to show how it can be used as a great confirmation for your trades here.

Running late

Will post updates in comments shortly or another post. If not keep this for comments for the day =)

Monday, May 11, 2009

New Week

I hope everyone had a great weekend. Of course as always I did some charting and as a result came to some new conclusions for our long term targets. As always, a great idea to re-read my current long term outlooks here.

I will try to post some charts some time this week to make it easier to understand where I am coming from. First off let me re-state a few statements I have made last week.

1) the line in the sand of 912. We have exceeded this line in terms of close price and have managed to close the weekly at 929. I had mentioned on Friday that a close at the high is the most likely scenario and we closed one point off the high.

2) Upper bollinger band ranges - another major concern of mine was the continuation on the upper ranges of the bollinger after having seen a breach on the 2.5 deviation upper line. This is something that "should" not have occurred but gives us great clues going forward.

3) Topping range at 930 - I still believe that last week marked a significant high at the 930 range. I know many are "waiting" for the 945 and the 950 range (200dma), however it is my feel that we will not be able to reach this range. Why is that you may ask? Because quite frankly EVERYONE is waiting for this range. The same way I had waited patiently for the 640 range off our low it never occurred - the same can be applied here.

It is quite surprising to see many blogs talking about much higher numbers now. 1000 range, some even talk about higher ranges - blogs that used to be very bearish. Additionally they make mention of "the dip buyers will not let it drop", "the dip buyers will not give this up so easily". Just so you know - its not the dip buyers that allowed this market to get this high - they came in and pushed it higher as a consequence of funds staying with their current inventories. Bears are scared, bulls are happy and mutual funds are opening bottles of champagne because they cannot believe they got this lucky to be here.

"be greedy when others are fearful, be fearful when others are greedy"

Now, I do have to admit that my long term forecasts for the year may have changed slightly. I am still a strong believer of the 480 range, a range we will visit but the probabilities of this occurring during my fore casted time windows of September/October is getting smaller. Instead a new pattern has come into play for me. As you remember I had talked about the accelerations occurring in the market place since the beginning of the year, those became apparent during our drops in February and March and of course during our major rally off the March lows. It is my feel that this acceleration will come to a stop very soon leaving the next leg down with quite a bit less momentum. My most likely scenario at this point is to create a higher major low in the low 700 (716 to be exact) range by the September time frame, followed by another leg up that can either break the high we are creating now or stall slightly below.

As I did not have enough time this weekend I will be creating another major update some time this week to put the proper justifications in that post and describe what needs to occur for this new pattern to become valid.

Just on another side note - financials caused this mess we are in, any rally that is lead by financials is a bear market rally and will be sold off.

Sentiment is seeing a major change at the moment - a change that may leave many with new conclusions that will ultimately be painful for their trade strategies. This rally has questioned many traders and investors, fundamentally and technically. Its normal for human nature to try to make conclusions based on this occurring but I am strong on my view points, yes I have questioned myself and had crazy thoughts in my head about where we will head - but this is precisely what we need to try to avoid. Do you have the same beliefs today as you had them in January 2009? I do - I made some slight adjustments and am cautious about a new major pattern developing but my primary target is still 480 by September this year. This pattern has until the end of this month to prove itself, depending on how we close out the month I may have to make adjustments to leave the low of the year for another time target, however nothing changes in terms of the direction for the next 3 months - all signs are pointing down - how low? we will know by the end of this month =)

Good trading everyone. And sorry for no charts but I will make a larger post some time this week with proper justifications.

Friday, May 8, 2009

Short Post Today

Not a lot of time this morning. Futures already breached the 920 range that I was holding out for to short. Job reports today "should" be positive giving more upside. While we had a great reversal day yesterday we did not break the low for the week which makes yesterday yet again bullish.

I had closed out my SDS at 907 as a break here indicated further upside to be able to enter at a better price. We have broken 912 decisively now which was my line in the sand. On the upper ranges we have the 945 and of course our dropping 200dma.

I will post more updates during the day as time permits.

Thursday, May 7, 2009

Could it be?


When even the most committed bears capitulate the top is made. I got stopped out of a large futures short early this morning around 5 points off the high - and I made no attempts to re-short using futures.

Talking about salt on an open wound ....

EDIT: Added nasdaq

Bullish Hammer?


We had a nice hammer form on the daily yesterday. While under normal circumstances this is a bearish sign I had warned yesterday that a close above 912 is bullish. Well here we go, futures are already higher with everyone waiting for the jobs result today. Regardless of the data it should be interpreted as a positive sign. What is really concerned to me is the upper breaches on the bollinger bands, as the band widens we are staying in the upper ranges and may have another up day yet again according to futures. This is a key difference from previous rallies and tops.

While we had a typical breakout pattern off the 870-880 range with a STRONG break in terms of price we have not confirmed this move yet with volume. However, proper bullish confirmations have not worked very well in the past few weeks, but the end result is up. We continue moving higher on lower volume and there seems to be no stopping this train. I had made a joke about this bull bus not being a bull bus - well here we are at 920+ premarket, with me in front of a loaded bull bus.

I have to admit I am a very frustrated bear, close to capitulation. Not only did I miss the biggest rally there was, we had very clear signs for this. As you remember I had mentioned over and over again that the 800 range is a key range - there is trading above 800 and trading below 800. Never around 800. Here we are more then 100 points away from this key range with me having been short most of this run.

I had mentioned it in the comments but this rally has cost me a lot. My current draw down is substantial and the total cost in terms of my capital has been a little under 100 points at this point. In the big picture of things I could say this is acceptable on a risk reward ratio of 100 to 300 points (risk 100 to make 300, assuming a move towards the 600 range), however this seems like too good of an excuse for improper money management. Just so you know, my long term targets have not changed and this rally is still inline time wise with our beginning of march forecasts.

In terms of my trading this rally had 3 phases for me. Phase one with the mid 700 range with me trying to short and of course failing. Sense finally got beaten into me once we reached the 800 range with a break. From here on out I started to take it easy on shorting and focused more on day trading and small swings - I did well there and recovered a lot of my previous losses. However the past 3 weeks my primary focus yet again has been on building a long term short position. The problem with that type of move is that your primary focus is on protecting this position and the constant need to micromanage the short as I am going against the trend. For each 10 points up I have lost around 3-4 points on average - painful.

So where are we now? Futures have inched higher and higher and we are preparing for yet another GAP up. At the moment we are trading at the 928 range on the S&P500. My final "this is it" target was 912 on the S&P. A range we hit this week, and a last attempt from me before I capitulate. From a risk reward perspective, regardless of how high we go on the short term, we will get back to our rising 20dma which in the worst case scenario will be at the 900 range even if we visit 945+ before this week. Having broken 912 also increases probabilities of a move higher to retest the 200dma that has been dropping as we trade higher - I am unsure how much of a retracement we will get before this move, but to be quite honest it should be minor without breaking the current uptrend channel.

The ironic thing is that we have been right on many of the calls. As you remember the debate a few weeks ago (not just on this blog) our weekly chart had a bearish candle and we had a strong assumption that this was indeed bullish by creating a base to take out the high. Did I put a trade against this? Nope I did not.

I know hindsight is 20/20 and its easy to sit here stating whatever case after the fact. In all honesty, from a long perspective, this rally has been the easiest pattern to trade - 200+ points of it.

So in summary, I have been very wrong during this phase of the overall crisis. My overall bearish sentiment has hurt not only me but also my readers to clearly see what is occurring. In the past it was black and white for me stating both sides of the story, recently it has been justifying my short stance. Maybe the addition of twitter has hurt me as well trying to justify my public trades and coming up with defensive facts to support the position - regardless I would have done the same.

Yes - this sounds like a capitulated bear which means the top is in.

Wednesday, May 6, 2009

Lets play happy bear for a moment ...

As you know I refuse to stop calling a top now, because quite frankly I have been wrong over and over again. As you remember I had mentioned do not be hopeful - well here comes hope.

Take a look at our 945 top back towards the turn of the year.


MACD was coming from positive divergence to zero, made another move into positive divergence before the final drop into negative divergence.

Take a look at the bars. One strong up bar, one small down candle, now the next candle is where it gets interesting.

Take a look at today ...


We created a marginal new high (915 today), we should retrace down during the intra day without a retest of the previous bar intraday low and close slightly up.

We had a lot of trouble with the 902 yesterday and only broke it at the end of the day. If we follow the same pattern as in Jan our low of the day would be 902 with a close at 906-907. We know the importance of 906-907 so its a reasonable expectation. This would fit in perfectly as a replica towards the last major top.

Its ok to have hope right?

Short Post Today

No real updates. Yesterday was distribution, which is quite bullish. BAC needs more capital, we already knew that, private sector job reports pushing futures up.

My painful start for the day is ...

05/06/09 08:13:59 AM Sell ESM09 897.75
05/06/09 08:15:43 AM Buy ESM09 904.75 (stopped out within less then 2 minutes with a sizable loss)

Lets see if we can take out 912 today and go all the way to 922.

Tuesday, May 5, 2009

Two Charts Today ...


Take a look at the bollinger band. I am using a deviation of 2.5 (instead of 2.0 default). A fellow reader had brought this to my attention back in January and has been proven to be more successful of a sign then using the 2.0 deviation. In the past 2 years there have only ever seen 3 breaches of this upper range. All 3 of them came with a strong reversal that followed. Also the last time this occured it marked the end of the bear market rally back in May 08.

Also, some may be referring to this being a breakout to the upside - look at volume. Volume failed to confirm this as a breakout move eventhough we were able to remove quite a few of the overbought conditions in the last weeks when we had created a base to take out the high.


This is just re-updating the current patterns we had indentified. One thing that concerns me a bit is the breakout of the MACD, while this can be explained due to a frenzy buying event yesterday its still something that we need to monitor closely. Also a horizontal line at the 912 range I had referred to as a potential top. As you can see in the green the narrow trade channel is still valid and we have tested the closure point of the bearish rising wedge. Both upper and lower line came together yesterday and were touched as the high of the day into the close.

Today is going to be quite difficult to make a call. Of course I am looking for a reversal here but to be quite honest we will have to worry about dip buyers stepping in. If the bears can step in with volume here and make a stand we should be starting a move to test the 880 and 860 respectivly. The past weeks I have been rather cautious on my trades and strategies, however, currently short fairly heavily without any hedges. Can I be wrong again? Yes very likly as we do not have a confirmation yet but I am trading what I am seeing. And I am seeing exhaustion and frenzied buying that cannot be sustained long term.

Saturday, May 2, 2009

Weekend: Back in town

Back in town and 13 hours of sleep on me =) First off last week I was a bit slow with updates so lets make up for it over the weekend. Charts are a bit larger as I am back home with my larger monitors (let me know if you prefer smaller sizes).

SPY 150 min
First off lets take a look at our channel yet again. I made it 150 min and included after hours so you can see some of the channel end points a bit better. This is pretty much year to date on spy so you can see what we are working towards.

3 main patterns to look at. First of course the wedge in the dark blue outline. We had our breakout and failed as we had described in the past. Now interesting enough we created another very small trade channel here that is parallel towards the wedge trendline. You can see that new channel after we broke out is a lot narrower and has the same up angle as well. Narrow channels such as this cannot be sustained for long so I see us moving out of that range very soon.

Additionally our breakout using the triangle with a retest of the upper declining range. Still above which is bullish but with huge pressures on the 76% FIB levels.

Now let take a look at FIBs. As you can see we have had an incredible rally off the lows without any type of retracement. Normally on such strong moves you need to see wider ranges to allow buyers and sellers to distribute. This is not happening here, we keep on going up not allowing any breathing time in between. However the last hurdle you see here, 76% retracement level is going to be quite difficult to brech. We attempted a breah in January and Feburary to fail both times. We have the same challenge yet again and it is my feel that a break at this level will not occur. If we do see a breach here you can see that we have a lot of room without stopping all the way to 945. Of course you know my target of 912 that should stop the bulls.

At the moment the market is trapped and various patterns have tried their best to break above the 880 range but thus far have not successed.

1. Failed Wedge Breakout (blue) (keep in mind the failed wedge breakout pattern is bullish, where as the wedge itself is bearish with the assumption of seeing a reversal)
2. Bullish Continutation Triangle (yellow)
3. Mini channel (parallel to lower wedge line)
4. Larger up Channel

All of those patterns are putting immense pressure on the 76% range, however all patterns have failed for a clean break this far. We had one failed attempt thus far that occured on low volume and was quickly reversed just to gain traction again on the Mini channel and the triangle breakout range.

Now being a bear, all you can do is smile here and sit patiently. Bears have time on their side, bulls do not. Every day that goes by each bullish pattern will get weaker and weaker. Additionally the bulls have no choice but to make a break here and now. If we retrace first ALL of the current bullish patterns will be invalidated making it impossible to reattempt this range.


VIX Daily
Lets talk a look at the VIX. As you remember I had referred to the triangle on the VIX but missed another important pattern. A bullish lowering wedge. And what a wedge this is. As you remember for wedges I am looking for a breakout in the last 20% of the range. We are there at the moment and you can see what range we are shooting for as the first target. VIX is telling us breakout imminent if we follow my wedge breakout strategy. Now what else is showing us imminent breakout signs? Lets take a look at the BIG picture yet again.


S&P 500 Daily (2 years)
Ok first lets take a look at our bollinger bands. I made yellow circles around the areas where the delta between both bands was the narrowest. Additionally both bollinger bands are now above the 50dma - same as it occured last year May. Unless this is a new bull market (no comment) we will reverse towards the downside very soon. Also MACD and momentum both showing severe divergence. MACD at zero still !!!! Take a look at the range we are seeing in as our MACD continues dancing around the zero line, spinning tops that keep on stretching that rubber band until it will snap.


Summary
Its so easy to get emotional when you stop being rational and objective. Due to work and travel last week I had lost my objectivity yet again by not having focused on the markets and my head became consumed with "what if, what if" scenarios that had no support behind them. I am still short and will be adding strongly next week.