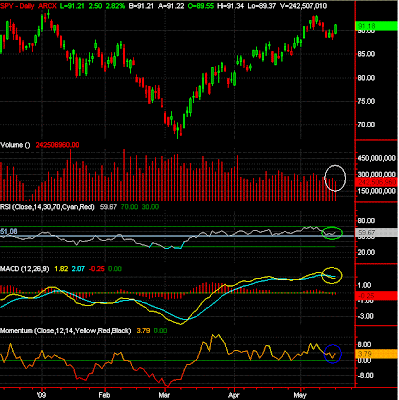
 Per CNBC - largest up day since March 6th (or May 6th - only caught it while walking by - a huge up day nevertheless).
White - TINY volume for such a strong price move - like lowest volume. Anyone who also frequents corba's market view blog - [Prices up, volume down = most bearish]
Green - bounce off the RSI support level
Yellow - MACD daily divergence still below zero, chances of getting another move into positive divergence are VERY VERY slim (but should not be ignored as a possibility)
Blue - Momentum not confirming up move.
As per comments ... "Tape buying is getting very very very very (again very) tiring ..." on the other hand thanks for letting me improve my average prices.
Waiting for futures to tell me about tomorrow. However looking at charts such as is. Stepping days will give you another continuation the next morning. Since we reached my price targets of 907-910 today on yet another crazed buying event we need to assume 916 as another level for continuation tomorrow.
Another comment worth mentioning.
"I call days like today "stepping days" ... cause they kind of look like steps. Break into new range, sideways within that range, break into next range, sideways in that range, etc.
Coupled with low volume this is setup to go one more level up. However, looking a bit toppy here, once it breaks back into previous range it should continue to the bottom of that range, however, do not like trading days like this."
I have 2 time windows for a change of trend for tomorrow morning - 9:55-10:05 or 10:25-10:35 - that would be my perfect bear case. Will take anything else though =)
Thanks for this Chris. Appreciated.
ReplyDelete